Joining the Renewable Heating Hub forums is completely free and only takes a minute. By registering you’ll be able to ask questions, join discussions, follow topics you’re interested in, bookmark useful threads and receive notifications when someone replies. Non-registered members also do not have access to our AI features. When choosing your username, please note that it cannot be changed later, so we recommend avoiding brand or product names. Before registering, please take a moment to read the Forum Rules & Terms of Use so we can keep the community helpful, respectful and informative for everyone. Thanks for joining!
Problems with sizing a replacement for a Viessmann Vitocal 200-S
I have at least answered my question about the ERA5 data gridding: it is 'regridded', at a horizontal resolution of 0.25° x 0.25° lat/long or 17 x 11 miles but it is based on NWP (numerical weather prediction) methodology which as the weather Johnnies are forever telling us is based on the laws of physics but still manages to get the forecasts wrong, often very wrong, and I have no doubt the same uncertainties apply to the so called ERA5 reanalysis. What is not clear, at least on first glance, is how many observations are used, and where they are taken.
There are other problems. The first is temporal resolution. I think the ERA5 data is probably run every 12 hours - so how do they get the hourly data? The other is the nature of the modelling and gridding means that the effective resolution is more like 4-5 grid lengths, say 75 x 50 miles (or maybe a bit less - but it is still hardly a fine resolution).
What all this means is that the ERA5 data is not observed data, it is in effect a forecast of what the weather was like in the past. The bizzareness of this notion should be more than enough to make one's sceptical muscle twitch.
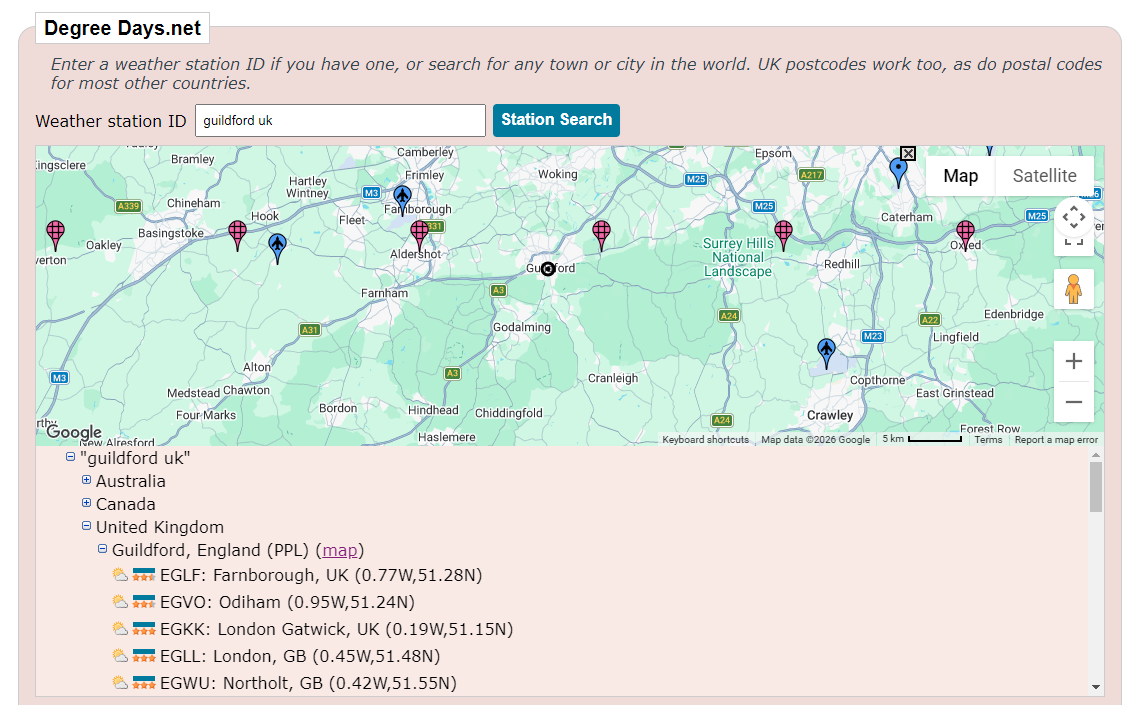
degreedays.net has figures from actual weather stations. Personally I would pick a close one unless in a frost hollow.
4kW peak of solar PV since 2011; EV and a 1930s house which has been partially renovated to improve its efficiency. 7kW Vaillant heat pump.
degreedays.net has figures from actual weather stations
Yes, but @jon used ERA5 data, which is based on NWP modelling. I'm not sure we know how well the modelled outside air temperature (OAT) corresponded to the actual OAT. One way of checking it would be to compare the ERA5 data with data from a known observation station, but that would only be for that location. Weather is a most slippery thing.
Midea 14kW (for now...) ASHP heating both building and DHW
degreedays.net has figures from actual weather stations
Yes, but @jon used ERA5 data, which is based on NWP modelling. I'm not sure we know how well the modelled outside air temperature (OAT) corresponded to the actual OAT. One way of checking it would be to compare the ERA5 data with data from a known observation station, but that would only be for that location. Weather is a most slippery thing.
All agreed. I was suggesting degreedays.net as an (alternative) source of data that appears to come from actual, identifiable, weather stations
4kW peak of solar PV since 2011; EV and a 1930s house which has been partially renovated to improve its efficiency. 7kW Vaillant heat pump.
@transparent Sorry for the silence, I'm working today but will reply properly this evening (yes, ERA5 was Claude's choice, but I can go back to degreedays.net and I also have my own temperature sensor figures).
I was suggesting degreedays.net as an (alternative) source of data that appears to come from actual, identifiable, weather stations
Yes, I got that, but it also has dispersed data. Suppose you live in Guildford, which weather station do you use, and how much credibility do you give it for your local weather?
Midea 14kW (for now...) ASHP heating both building and DHW
Guildford is a University town. If Jon were there, there a reasonably high probability that the local data he'd want is already made available for use by University of Surrey students.
Tell them what you're attempting, and give them the URL of this Forum Topic. You might find there's an overlap with something already being looked into.
This post was modified 1 month ago 2 times by Transparent
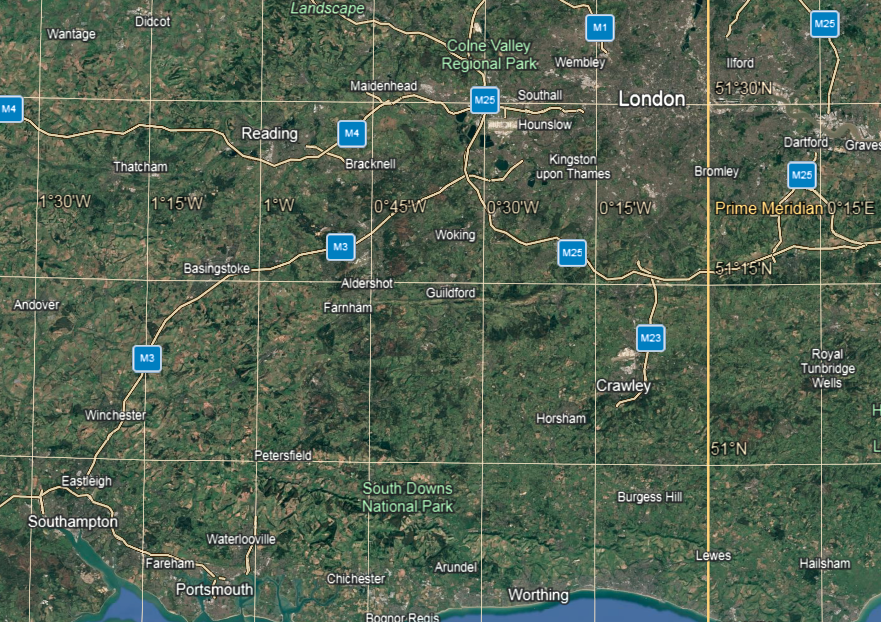
This is the size (but not as I understand it the boundaries, the lines are actual lat/long and the crossing points are the centres of each of the cells) of the ERA5 grid overlaid over Surrey in Goggle Earth. The lat/long is in degrees/minutes (° ') and 15' is 0.25 of a degree. My understanding is that ERA5 has a single surface (at 2 metres height) temperature for each cell in the grid. It is evident that each cell covers a large area, but it is worse than that because the effective resolution of the 'forecast' is around 5-7 times the grid size, an area larger than the whole of Surrey, with some suggestions it may be even larger. Worse than useless for a point location estimate (at a specific location)...
The main reason the effective resolution is much larger than the grid size is the model is smoothed to iron out irregularities (basically, it is too sensitive, it gets ahead of itself). Another problem is the weather is analogue (continuously variable) whereas a computer can only do digital (calculations are done on a finite grid, and computing power limits the number of grid points there can be, and so how small the cells can be). Furthermore, ERA5 is not even really meant for this point in time and place work, it is more about patterns and trends, and even there it is not without its faults, though maybe, I concede, it is perhaps better than nothing. Back in the real world, you want real observations from real weather.
This (choosing a doomed methodology) is a good lesson on why you really do not want to use AI for anything more demanding than deciding whether your banana is ready to eat.
Midea 14kW (for now...) ASHP heating both building and DHW
@jamespa Thanks for this. Let me address the hot water point first. The basement plant room has two Viesmann Vitocell 300 hot water cylinders, each with a 200 l capacity. The boiler is on the second floor, so the water from the boiler has to travel down three storeys to the plant room.
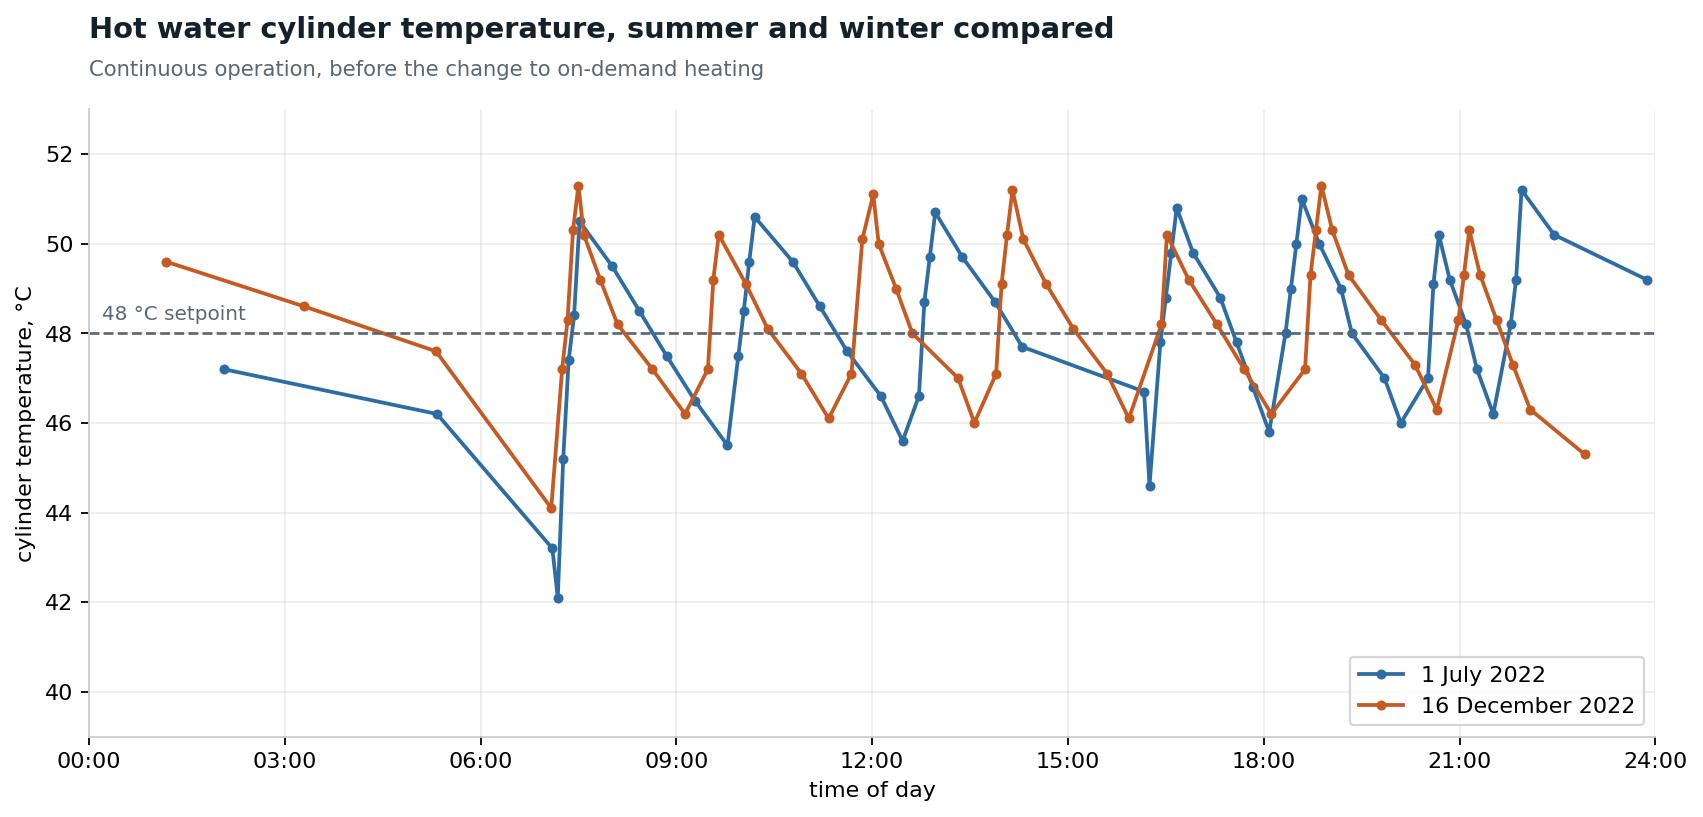
The DHW storage temperature is set to 48 and the boiler starts heating the cylinders when the temperature drops to 46. It stops heating when the temperature reaches 50. The temperature sensor is in one cylinder only (although I recently added a temperature sensor to the other cylinder).
Here is chart of the hot water temperature over 24 hours for one day in July 2022 and one day in December 2022. For both of those times, the hot water was on from 07:00 - 22:00, with the secondary pump running continuously between those times.
On your other points, blob size on chart 5 is the interval length in days. I don't have a smart gas meter and wasn't taking daily readings as access to the gas meter is a bit awkward. I have more recently set up a system that gives me realtime meter readings. But the max is 8 on chart 5 because of the uneven and long intervals between meter readings during the period.
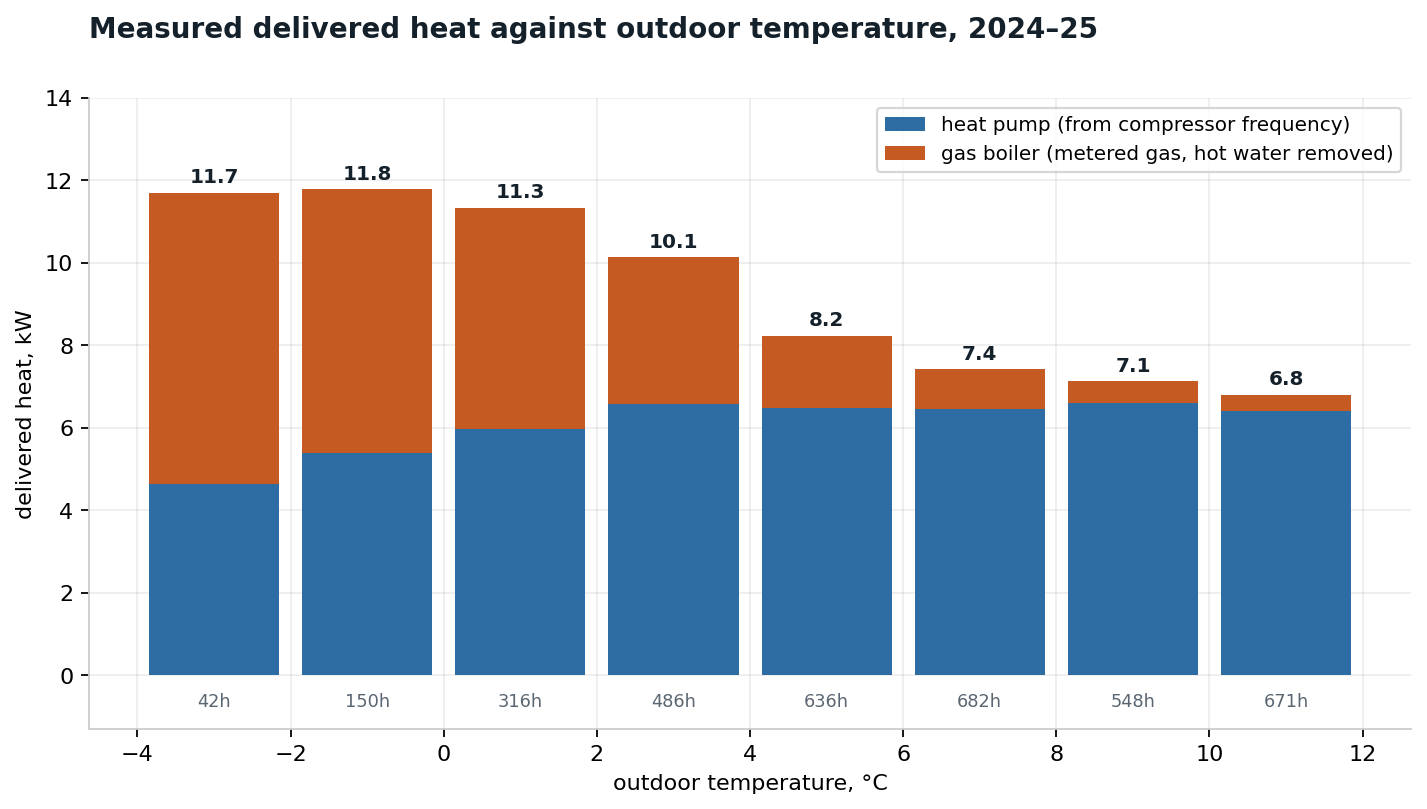
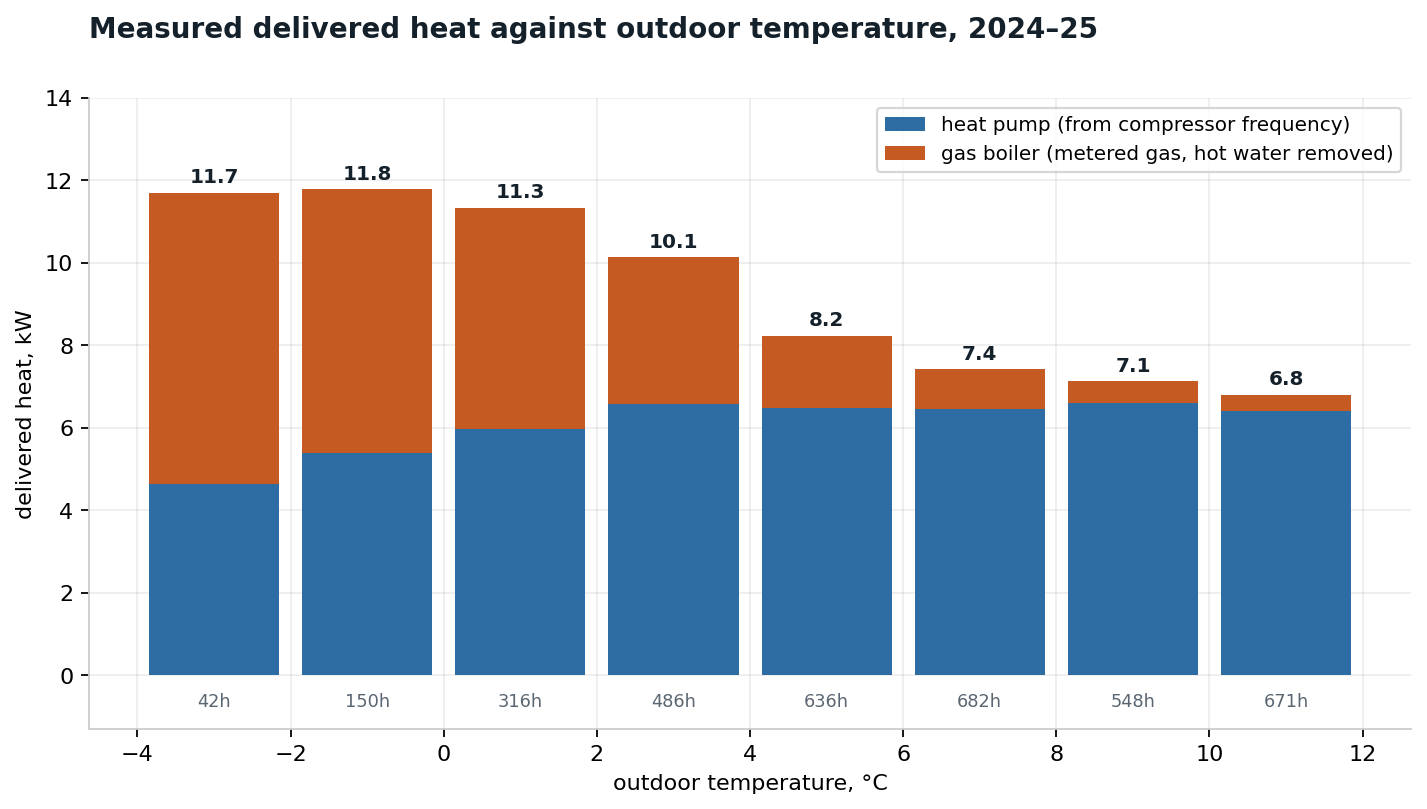
The problem with chart 3 is that it was only built from the hours when gas was logged. I've rebuilt it on a complete hourly index with unlogged hours as zero gas and it's looking a bit more realistic. Although I still don't understand why the three coldest bands are so flat.
Doing all of this has exposed a problem with my current setup, which I was actually trying to understand last winter. Viessmann uses an integral of the difference between the set and actual flow temperatures over time to determine when to engage the boiler to supplement the heat pump. A motorised mixing valve blends between the boiler and heat pump to maintain the flow temperature. The boiler is switched off if the flow temperature exceeds the set temperature over a period of 10 minutes or if the mixer closes completely.
Although the boiler comes on correctly, it stays on for far too long, with the compressor only operating at around 49 Hz. I think it's because the heat pump is defrosting more frequently, so heat pump never manages to maintain the set flow temperature over a 10 minute period. I wonder if this is the cause of the flatness on the chart.
I will set the bivalent point to 0 C (it's currently 6 C) and see what happens this winter. Realistically, I'm not going to be replacing the heat pump before the spring now. Hopefully it won't give up the ghost and if it does, I can fall back to using the gas boiler.
@cathoderay@transparent@jamespa I've got data from my outside temperature sensors (mounted on a shaded, north facing wall) so I might try again using these instead of ERA5 or degreedays.net data from EGLL.
Viessmann uses an integral of the difference between the set and actual flow temperatures over time to determine when to engage the boiler to supplement the heat pump. A motorised mixing valve blends between the boiler and heat pump to maintain the flow temperature.
Do you have a source reference to Viessman's manuals where this approach is described by them?
The boiler is switched off if the flow temperature exceeds the set temperature over a period of 10 minutes or if the mixer closes completely.
Well, yeees...
but where is the sensor which provides that temperature information to the boiler?
Is that mechanism an integral part of the Viessmann firmware within the heat-pump? Or is it in a separate "dual fuel" control box which has its own temp sensor?
10-mins sounds a very long time interval over which the boiler will continue to operate, especially when the heat-pump is already known to be operating inefficiently.
Here is chart of the hot water temperature over 24 hours for one day in July 2022 and one day in December 2022. For both of those times, the hot water was on from 07:00 - 22:00, with the secondary pump running continuously between those times.
Ah. If the 'secondary pump' means a water circulation pump, that explains the very high apparent DHW usage. If so its not actual water usage, its energy lost to the house because you are continually circulating hot water. The difference between natural cooling of the cylinder and forced cooling of the water due to recirculation appears in your plot as a change in slope. This is the major disadvantage of recirculating DHW systems. In winter the 'loss' is to the heated envelope of the house so not a disaster, just an efficiency penalty. In summer its to the house which you are trying to keep cool which is not so great.
Incidentally the recirculation could well explain your apparent 13C degree day 'base' - there is a feed of ~ 1.3kW into the house from your DHW pipes for most of the 24hr period.
But the max is 8 on chart 5 because of the uneven and long intervals between meter readings during the period.
I guessed as much. So effectively each point is an average over many days. That shouldn't make a vast difference but it does mean that we are not seeing the extremes represented properly. I cant see how it accounts for the differences we are seeing, but then something must.
The problem with chart 3 is that it was only built from the hours when gas was logged. I've rebuilt it on a complete hourly index with unlogged hours as zero gas and it's looking a bit more realistic. Although I still don't understand why the three coldest bands are so flat.
If you were to draw a straight line between the rightmost bar and the 4-6C bar, the bars for -2-0, 0-2 and 2-4 would lie above the straight line. I suspect what you are seeing may be to do with the effect of defrost increasing the total energy requirement/decreasing heat pump efficiency. This is a guess I admit but the path of the straight line tells us something and helps to make the flatness below 2 much more credible.
I will set the bivalent point to 0 C (it's currently 6 C) and see what happens this winter. Realistically, I'm not going to be replacing the heat pump before the spring now. Hopefully it won't give up the ghost and if it does, I can fall back to using the gas boiler.
Realistically, I'm not going to be replacing the heat pump before the spring now.
It would be well worth giving some careful thought to what to measure and how. I dont particularly feel comfortable with deducing heat pump output from compressor frequency, the more usual way is to measure flow temp, return temp and flow rate. Unfortunately temperature sensors can be 0.5-1C out, which means that comparing two to measure a small difference is not particularly accurate, and flow rate meters are not always great. I would be tempted to calibrate the temperature sensors (what you need is their relative offset). You have a real issue to solve namely that your heat loss is either 12kW or 18kW depending on what measurement you believe, and that is just too big an uncertainty to be comfortable.
That said if your plan, should it turn out to be 18kW, is two heat pumps, one possible way forward is to fit a 12 (or the largest reasonable capacity you can find), retain the boiler, and see how it goes for a season. If it turns out not to be sufficient, fit a 6 in addition, which will give you a modulation range of 18kW down to 2kW with the right control algorithm. Not sure if any heat pump on the market does that, but it could probably be engineered with a little thought.
10-mins sounds a very long time interval over which the boiler will continue to operate, especially when the heat-pump is already known to be operating inefficiently.
Strikes me that the boiler is going to be operating extremely inefficiently when paired with the heat pump unless its a very low output model designed specifically as a supplementary. If not the demand is small and so it will be cycling furiously, with most of the energy going up the flue.
This post was modified 1 month ago 8 times by JamesPa
4kW peak of solar PV since 2011; EV and a 1930s house which has been partially renovated to improve its efficiency. 7kW Vaillant heat pump.