

Notifications
Clear all
Joining the Renewable Heating Hub forums is completely free and only takes a minute. By registering you’ll be able to ask questions, join discussions, follow topics you’re interested in, bookmark useful threads and receive notifications when someone replies. Non-registered members also do not have access to our AI features. When choosing your username, please note that it cannot be changed later, so we recommend avoiding brand or product names. Before registering, please take a moment to read the Forum Rules & Terms of Use so we can keep the community helpful, respectful and informative for everyone. Thanks for joining!
Air Source Heat Pumps (ASHPs)
38
Posts
6
Users
14
Reactions
1,546
Views

Topic starter
31/08/2026 4:19 pm
Apologies in advance for the long post!
My house has run on a hybrid system since it was built in 2013: a Viessmann Vitocal 200-S air source heat pump working alongside a Viessmann Vitodens 200 gas boiler, installed together on Viessmann controls. The heat pump is type AWB-AC 201.B13, a 13 kW split, with the boiler covering the peak and doing all of the hot water as a design decision.
The heat pump has now reached end of life, with Viessmann confirming that spare parts are no longer available. Even though I had the fan motors and control PCBs replaced three years ago, I am worried that something else will break. Rather than waiting for this to happen, I would like to replace the unit and take the opportunity to remove the boiler at the same time to come off gas completely. I need to find a unit that will carry the entire load on its own and also do the hot water.
That makes the design load figure the whole question and it is where I have run into trouble. I have two answers that differ by a factor of 1.7, and I would like someone to tell me whether I have got this wrong before I commit to equipment.
The house
It is a developer-built detached house completed in 2013 in Surrey, on four storeys including a basement and rooms in the roof, with around 550 m2 of floor area excluding the garage. There is underfloor heating on three floors, radiators on the second and MVHR throughout.
The as-built U-values are 0.28 for the external walls, 0.16 for the pitched roof, 0.21 for the flat roof, 0.22 for the ground floor and 1.8 for the windows. Air permeability is 8.2, according to the EPC.
The data
The hybrid arrangement has given me two distinct measurement regimes, which is the reason this post might be useful to anyone else working a design load out from consumption figures.
The heat pump was switched off entirely from 2014 until February 2021 and the boiler carried the whole load, which gives a clean gas-only record; my meter readings cover 2015 to 2018 within that period. Since 2024 I have had daily gas consumption metered separately for hot water, along with heat pump output logged into InfluxDB, which gives a period where both heat sources are running and can be separated from each other.
Three methods
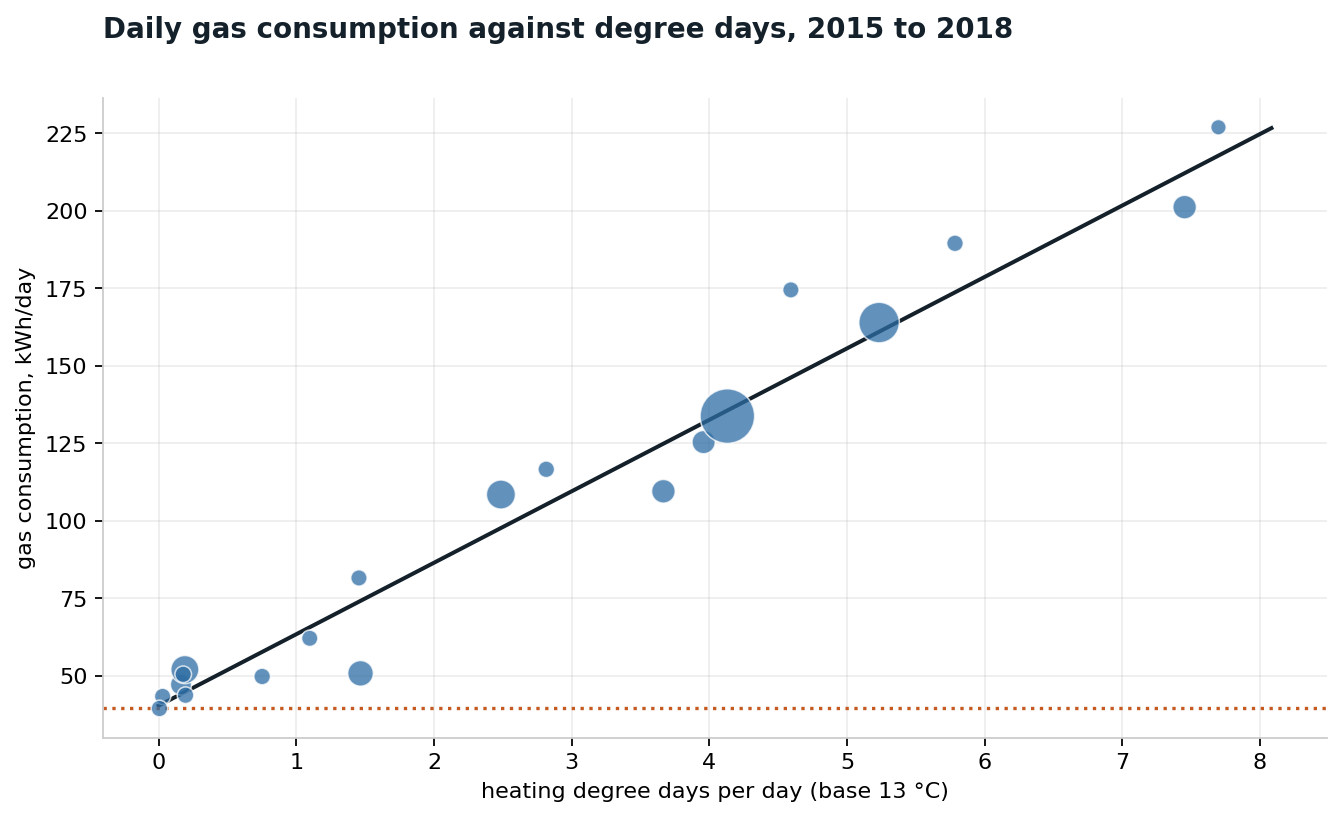
Firstly, I regressed twenty gas meter intervals from 2015 to 2018 against heating degree days computed hourly from ERA5 data at my coordinates. The hot water baseline was taken from each year's measured summer consumption rather than assumed, and the fit was forced through the origin so that only one parameter remained free. That gives 815 W/K at a fitted base of 13 C, with an R2 of 0.96.
Boiler seasonal efficiency is taken as 90 per cent gross, which is reasonable for a Vitodens 200 condensing on underfloor return temperatures. It is worth noting that gas meter readings convert on gross calorific value, so the 98 per cent net figure manufacturers quote is not the number to use here. Varying it between 85 and 92 per cent moves the result by about 1 kW.
Secondly, I took the 2024-25 season and combined heat pump output with boiler heat to give total delivered heat. That gives 814 W/K.
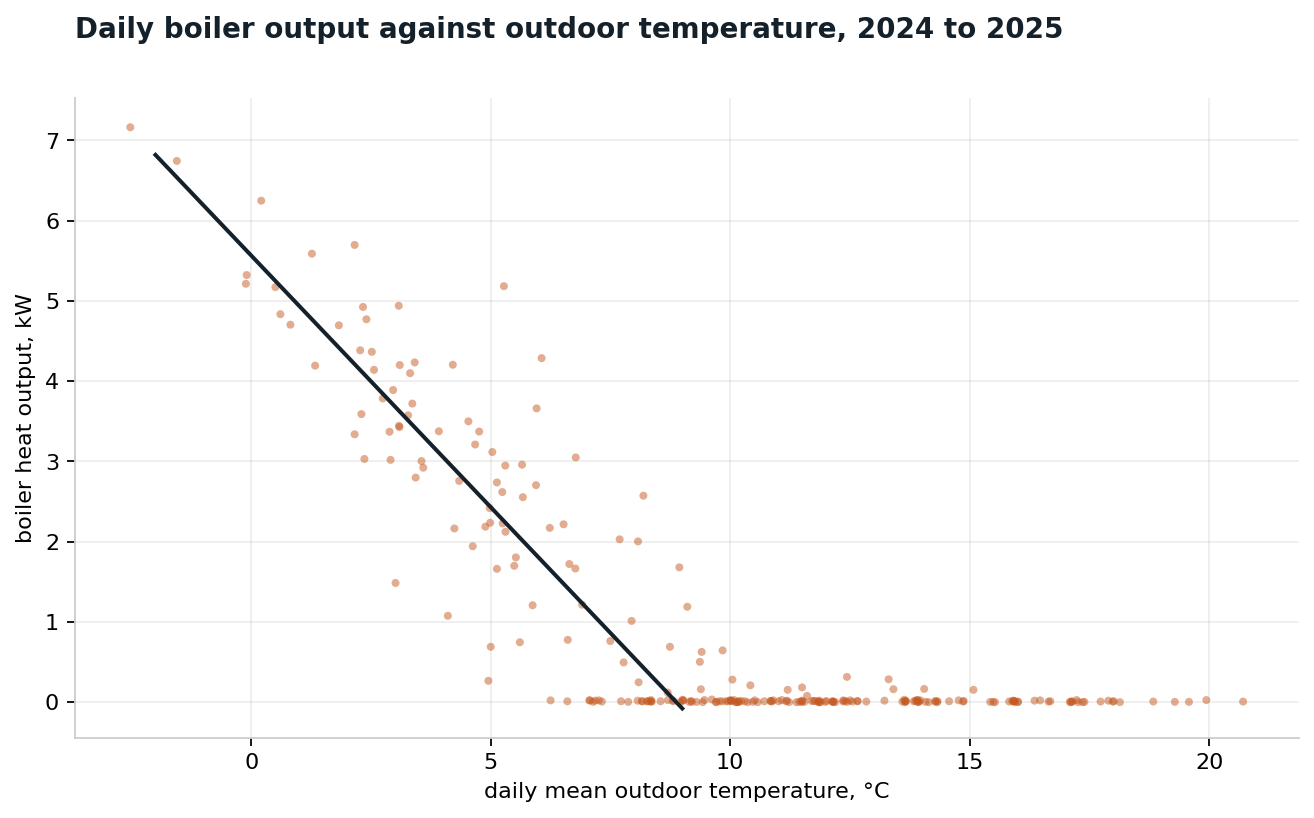
Thirdly, and this is the one I trust most, the heat pump saturates at around 7 kW below about 5 C and its output barely rises as the weather gets colder, so the boiler supplies almost all of the additional load. That makes the slope of boiler output against outside temperature a measurement taken entirely from the gas meter, with no heat pump instrumentation involved at all. The boiler contributes 538 W/K and the heat pump 276 W/K over the same weeks, giving 814 W/K combined. This is only possible because it is a hybrid, and it is the strongest evidence I have.
Where the calculator disagrees
The de Podesta HTC estimator gives 474 W/K and a 10.2 kW heat pump from the same consumption figures.
The entire difference comes from one assumption. The estimator places the balance point 3.5 K below internal temperature, which for me gives a base of 18.5 C and roughly 2,550 degree days a year. Fitting the base to the data instead gives 13 C and about 1,350 degree days. Dividing the same annual consumption by half as many degree days doubles the coefficient, so neither of us has made an arithmetic error, we have simply used different denominators.
The tiebreaker
In the week ending 13 January 2025, at a mean outdoor temperature of 0.8 C, the house consumed 12.75 kW continuously for seven days. Of that, 5.01 kW came from the boiler, which is a gas meter reading with no modelling in it whatsoever. The calculator's 474 W/K predicts 8.4 kW at that temperature, so the house measurably used half as much again as the model says it can.
Where I think I am weakest
A base of 13 C against a 21 C setpoint implies around 6.5 kW of free gains, which is considerably more than a normal house. Some of that is real, since there is a lot of south-west glazing and a secondary hot water loop was dumping about 900 W into the fabric around the clock until I put it on demand. But some of it is almost certainly that not every room sits at the thermostat setting, so 21 C describes the hall rather than the basement or the roof rooms.
Another thing worth knowing is that Viessmann's energy balance is calculated from temperature sensors rather than metered, and Viessmann themselves state it can deviate by up to 20 per cent. The bias is not random: calculated heat output tends to read high while calculated electricity reads low, so the resulting COP flatters and several owners have logged discrepancies of 30 per cent against calibrated meters. That is why the third method matters. If my counter overstates output by 20 per cent, the answer falls only to 760 W/K and 18.3 kW, because the heat pump contributes just a third of the fitted slope.
Where I have landed
The heat transfer coefficient is somewhere between 760 and 815 W/K, which gives a design load of 18 to 19.6 kW at -3 C on the MCS basis that ignores gains, or 14 to 16 kW if you credit the gains the house actually has.
I am specifying delivered output of 15 to 16 kW at A-3 / W37, to be evidenced from the manufacturer's capacity table rather than the A7 / W35 headline rating. Hot water is a comparatively small addition on top: around 10 kWh a day into a 200 litre cylinder at 48 C, which I intend to schedule on Agile Octopus cheaper rates rather than reheat on demand as the boiler currently does.
There is one piece of good news in all this. My weather compensation curve delivers 35.5 C flow at design conditions, which is low for a house this size. In 2018, running on the boiler alone, the curve was set to 54 C to hold the house one degree warmer than it is now, but that was using room controllers to regulate the temperature and I am not doing that any more.
Questions
I know there is quite a lot to take in here! But does anything above look wrong to you?
I don't think there are any monoblocs on the UK market that deliver 15 to 16 kW at A-3, so this looks like two units in parallel sharing the load. I should be clear that I mean parallel rather than a two-stage refrigerant cascade, which is what usually comes up when you search the term. Has anyone here actually run one domestically, and would you do it again? I have read the Grant Aerona 2x10 thread, which is largely about when the second unit should cut in, and that is precisely the part I would want designed rather than guessed at.
I am also open to being told that keeping the hybrid is the sensible answer at this size, but I would rather be rid of the gas and the standing charge that goes with it, and the boiler is thirteen years old anyway.
Separately, is anyone running active cooling into an MVHR duct cooler? I have that now and want to keep it,.
Full disclosure: I did the regressions and the degree day work with Claude, which pulled the hourly ERA5 data, ran the fits across a range of base temperatures and did the sensitivity analysis. The meter readings, the heat pump logs and the U-values are all mine and measured, and the arithmetic is all checkable. I mention it because the conclusion here contradicts a widely used spreadsheet and I would rather people know how it was produced and pick holes in it than take it on trust. I am happy to post the raw data, the workings or the code if anyone would like to.
This topic was modified 1 month ago by Mars

31/08/2026 10:26 pm
Thanks for sharing that. Your objective seems very sensible as is working out what to do before you are forced to do it in a hurry!
As to the calculations nothing looks majorly wrong at first sight except the factor of 1.7 discrepancy between different ways of determining the heat loss based on measured consumption. Thats a big discrepancy and, IMHO, it would be well worth trying to get to the bottom of this if you can before ending up with a dual pump system. Fundamentally that means trying to reconcile the figures.
I think this is a case where seeing the raw plots might help. Its difficult to understand how to reconcile W/K and offsets as numbers, but sometimes its easier to visualise. The force fitting through the origin might also be a factor that helps understand (or reveals an anomaly). Also when you say 'I regressed twenty gas meter intervals from 2015 to 2018 against heating degree days computed hourly from ERA5 data at my coordinates' does this mean literally twenty points. That's quite a small number and, combined with the use of artificial stupidity (AI definitely can get things wrong in my relatively limited experience) I wouldn't trust any output without visualising it. Also do the twenty points cover a wide enough range of conditions to give a sound read out or are they all too much of an average. I am presuming you don't have half hourly or even daily meter readings which could be plugged against daily degree days to give another view.
Do you have any hydraulic separation between heat pump and emitters and how does that relate to the boiler, is there any way relative efficiency of delivery of heat to the house could be influencing the calculation.
None of that answers your question I admit, but until the figures are reconciled I would personally be somewhat nervous, as I sense you are.
This post was modified 1 month ago 4 times by JamesPa
4kW peak of solar PV since 2011; EV and a 1930s house which has been partially renovated to improve its efficiency. 7kW Vaillant heat pump.

01/09/2026 5:58 am
Is the flow temperature for the rads and the underfloor heating different?
Topic starter
01/09/2026 10:09 am
@jamespa I have revised my figure downwards as a result of your scrutiny, so thank you!
The challenge about wanting to see the raw plots, and the question about hydraulic separation, sent me back to logs I had not thought to use. Between them they have produced a much better measurement than the regressions I started with, and it does not agree with them. I would rather post the correction than leave the original figure standing.
Everything in my first post was an extrapolation. I fitted a line to consumption against degree days and extended it to design conditions, because I did not think I had any relevant data actually at design conditions. It turns out I do: I log gas consumption hourly, I log hot water charging separately, I log the position of the valve that blends between the buffer and the boiler and I log compressor frequency. Putting those together gives space heating demand hour by hour, with hot water subtracted rather than estimated and with the heat pump's contribution measured rather than assumed.
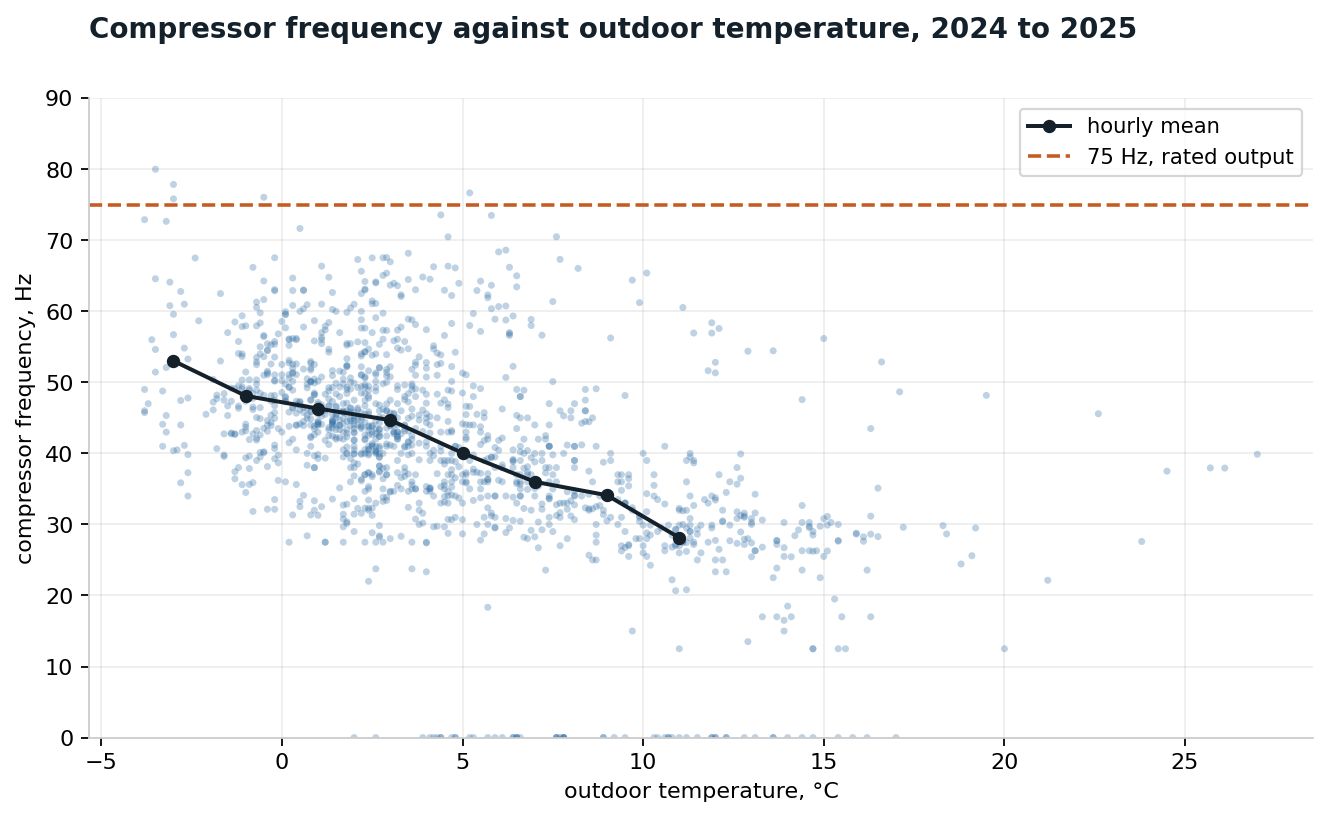
That last point matters more than I expected. My first attempt at this assumed the heat pump was running at its published ceiling whenever the boiler was called. It was not. Across the 40 logged hours between -4 and -2 C the compressor averaged 53 Hz, against 75 Hz for rated output on the Viessmann spec sheet, so the machine was at about 70 per cent rather than flat out.
What the hourly data shows
Scaling rated output by compressor frequency and adding the measured space heating gas:
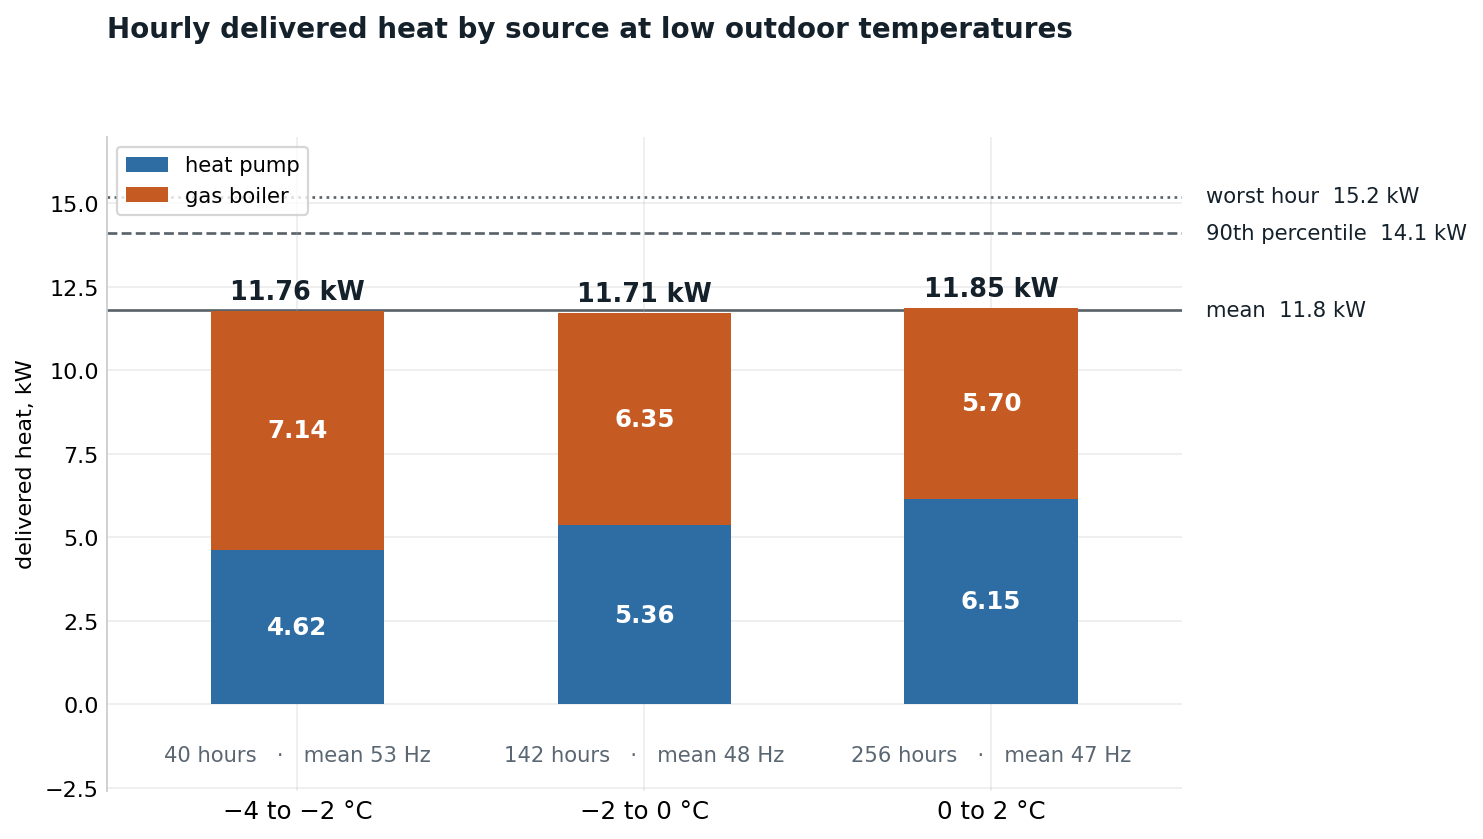
Between -4 and -2 C, 40 hours, mean 53 Hz, heat pump 4.62 kW plus boiler 7.14 kW, total 11.76 kW.
Between -2 and 0 C, 142 hours, mean 48 Hz, heat pump 5.36 kW plus boiler 6.35 kW, total 11.71 kW.
Between 0 and 2 C, 256 hours, mean 47 Hz, heat pump 6.15 kW plus boiler 5.70 kW, total 11.85 kW.
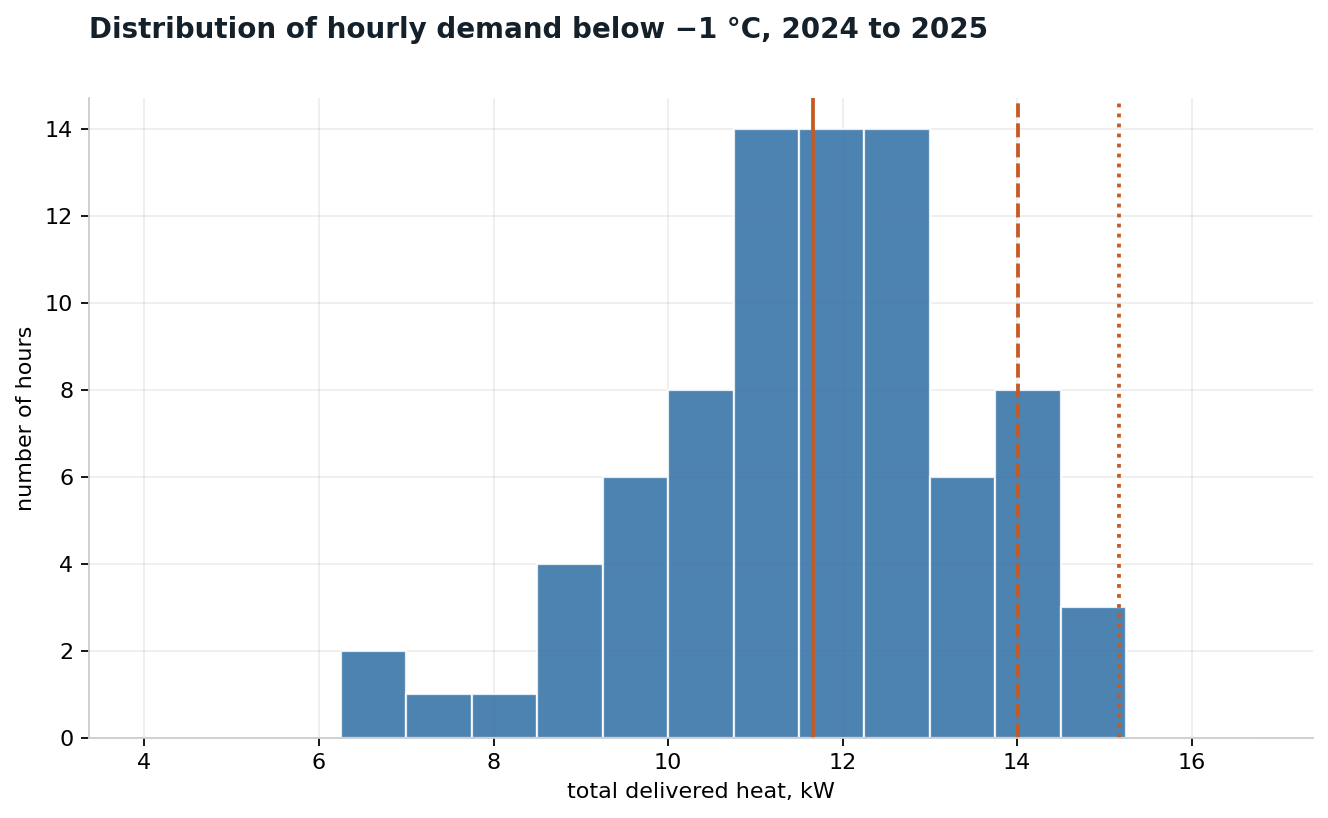
At design conditions that is 11.8 kW as a mean, 14.1 kW at the ninetieth percentile and 15.2 kW in the worst single hour.
I trust this more than the regressions because the 0 to 2 C band gives 11.85 kW, against 12.75 kW measured for the week averaging 0.8 C by an entirely different route. Also in that same week the Viessmann heat quantity counter claimed 7.73 kW from the heat pump while the frequency calculation gives about 6.15 kW, an overstatement of 25 per cent, which sits in the range German owners on the Viessmann Community Forum report for that counter. There are two independent confirmations out of one dataset, which is worth knowing if you rely on Viessmann controller figures for anything.
Here is the issue with the previous figures, which I should have spotted earlier. Measured demand of 11.8 kW at -3 C is what the house draws with its internal and solar gains present. Divide that by the temperature difference to the balance point and the implied heat transfer coefficient is about 740 W/K, which is close to the 815 the regressions gave. Apply that same slope on the MCS basis, which ignores gains because you cannot count on them on a still, dark January night, and you get 17.7 kW.
So 19.6 kW and 12 kW were never actually in conflict, they are the same building described under two different conventions and I kept sliding between them without saying which one I was using. That is on me (well, Claude!) an it explains a good deal of why the disagreement with the calculator looked worse than it was.
The original regression was also biased upwards for a specific reason. In the 2015 to 2018 data I had only annual meter readings and had to assume a flat hot water baseline across the year. In reality winter hot water consumption exceeds summer, because the incoming mains is colder and standing losses are higher and every kilowatt hour of that difference was being attributed to space heating. That steepens the slope most at the cold end, which is exactly where the extrapolation is anchored. I flagged this as a weakness in the original post but could not quantify it. The hourly data quantifies it.
Some caveats:
My hourly gas file only contains hours in which gas was actually consumed, so above about 4 C it captures only the unusual high demand hours and the totals are biased upwards. That is why the figures refuse to slope with temperature, which is obviously wrong. The cold end is reliable because nearly every cold hour has gas in it.
Output is assumed linear in compressor frequency, which is approximate and probably understates a little at part load. And rated output at A-3 is extrapolated five degrees below the lowest point Viessmann publish.
Where I have landed
The design load is 15 to 16 kW delivered at A-3 / W35, sized on the peak hours rather than the mean, rather than the 18 to 19.6 kW I posted originally. That is the number going to installers, evidenced from the manufacturer's capacity table rather than any A7 headline rating. On the MCS convention the same building gives about 17.7 kW, which is what an installer's own calculation will produce, and the two figures are consistent with each other.
For a house of this size the flow temperature is the one thing that has gone right. The weather compensation curve gives 35.5 C at design, so I can specify at the standard W35 rating point rather than interpolating, and the emitters were clearly oversized at build. Under the boiler alone in 2018 the curve was set to 54 C to hold the house one degree warmer than it is now.
For context on why the existing unit has always needed help: it is rated 14.6 kW at A7, 10.6 kW at A2, and extrapolates to roughly 6.6 kW at A-3. The nameplate is more than double the design condition output.
What has not changed
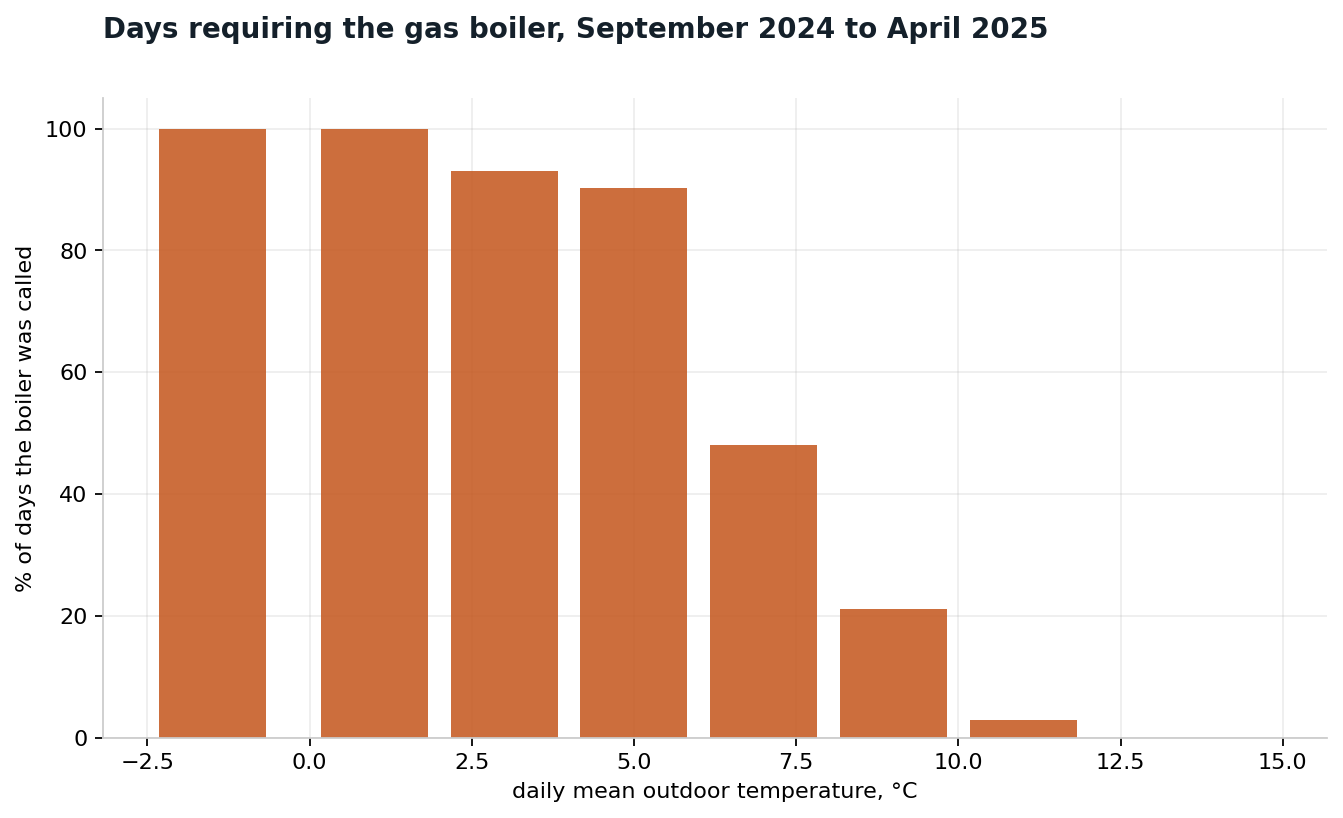
The calculator disagreement is smaller than I first claimed but has not gone away. It gives 474 W/K against about 740 measured, and it still predicts 4.8 kW of demand at 2 C when the boiler alone, with hot water subtracted at hourly resolution, averaged 5.70 kW across 256 logged hours in that band before the heat pump contributed anything. The valve log also shows the boiler being called for five hours a day at over 90 per cent on every day with a mean below 2 C, which would not happen on a 474 W/K house with a 13 kW heat pump.
Next steps I suppose would be a room by room calculation, on the grounds that measuring the building directly beats inferring it from consumption, however finely. Thank you for pushing on this, the original number would have cost me money.

Topic starter
01/09/2026 10:10 am
@bobflux It was originally, but now both are using the same heating curve, with the TRVs fully open.
01/09/2026 12:53 pm
OK. If you had two different flow temps and were going for 2 heat pumps, I was about to suggest splitting the installation, one high temp heat pump for the rads and another for the UFH. But this no longer applies.
The design load is 15 to 16 kW delivered at A-3 / W35
Defrosting included. Watch out, it is sometimes mentioned as fine print in the capacity tables but... sometimes not, and it is measured in certain conditions of temperature and humidity that may or may not match yours.
1
01/09/2026 8:41 pm
@jamespa I have revised my figure downwards as a result of your scrutiny, so thank you!....
That post sounded, in several places, just like the way ai responds, have you been spending too much time with Claude and picked up some 'ai speak'?
Without seeing the plots I can't comment further.
This post was modified 1 month ago by JamesPa
4kW peak of solar PV since 2011; EV and a 1930s house which has been partially renovated to improve its efficiency. 7kW Vaillant heat pump.

01/09/2026 8:46 pm
@jon - I'm finding this particularly difficult to follow because it's all text!
Can you not post the graphs on which your comments are based?
Scaling rated output by compressor frequency and adding the measured space heating gas:
Between -4 and -2 C, 40 hours, mean 53 Hz, heat pump 4.62 kW plus boiler 7.14 kW, total 11.76 kW.
Between -2 and 0 C, 142 hours, mean 48 Hz, heat pump 5.36 kW plus boiler 6.35 kW, total 11.71 kW.
Between 0 and 2 C, 256 hours, mean 47 Hz, heat pump 6.15 kW plus boiler 5.70 kW, total 11.85 kW.
At design conditions that is 11.8 kW as a mean, 14.1 kW at the ninetieth percentile and 15.2 kW in the worst single hour.
The fluctuations matter just as much as you telling us the mean.
[ @jamespa and I both posted to ask for the plots simultaneously! ]
This post was modified 1 month ago by Transparent
Save energy... recycle electrons!

Topic starter
01/09/2026 10:19 pm
@jamespa @transparent Sorry about that. Here are the charts, hopefully these are a bit easier to follow than the text:
This post was modified 1 month ago 3 times by jon
02/09/2026 8:08 am
@jon thanks for that.
Here are a few observations/questions graphs numbered left to right, top to bottom
1 - no particular comment
2- its a scattergram and Im not surprised. Heat pumps vary their compressor speed according to several factors so I would expect only a very rough correlation between compressor speed and OAT
3 - This is at the same time enormously suspicious and potentially enormously significant. Its enormously suspicious because the values at the different temperatures are so similar. Its potentially enormously significant because it suggests your house loss at design temperature may be 12kW. I really wouldn't worry about hourly max or even 90th percentile, houses respond pretty slowly so looking over 3, 6 or even 12 hrs is more appropriate. However the similarity of the val,ues gives rise to great suspiscion and I would suggest you need to verify the underlying data/method.
4 - would tend to confirm the potential conclusion from (3) but subject to the same concern about the data
5 - What is the significance of the size of the blobs? Looks like a nice straight line. If we take it at face value it suggests a consumption of 429kWh/day at -2 (15 degree days at a base of 13) and thus a loss of 17.6kW, which is ionconsistent with (3) by a margin sufficient to care about. What I dont understand though is why the max is only 8, suggesting that there were no cold days in the period measured which surely cant be true, or is each of the dots some sort of average?.
6 - Difficult to interpret because the heat pump output will change with temperature.
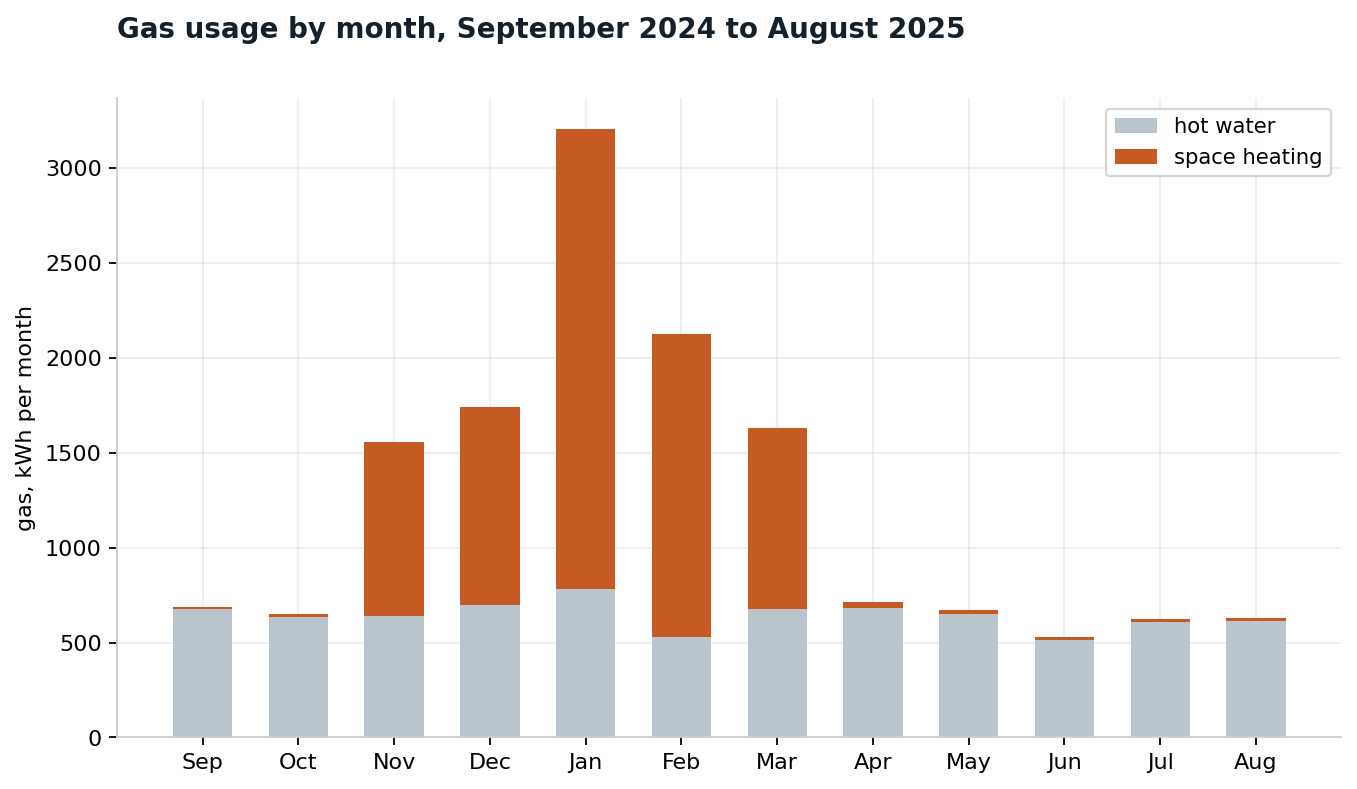
7 - That is roughly 500l or hot water (at 50C, which is much hotter than you can shower at) per day. Maybe you have a large family, but thats a lot by any reasonable standard. (700*3600000 = 2.5*10^9 joules per month, divide by 30 for days, 4200J/kgK for the specific heat capacity of water, and 40 for heating to 50C from an assumed input temp of 10 gets to 500)
For me the suspicious aspects of (3), the discrepancy between (3) and (5), and the questions re (5) are the next steps. If you could reconcile these and be convinced of the underlying data then you would have a tolerably sound basis to proceed. Currently I would say that you don't and, if I were an installer, I would ignore this data and go solely on a survey (Many will do that anyway!). With a house with your consumption I would, as a customer, be nervous about relying on a survey alone, but an installer is almost fully protected by following the methodology so doesn't have to worry!
In summary my recommendation is to dig more into (3) and (4) and check any underlying assumptions and calculations.
This post was modified 1 month ago 4 times by JamesPa
4kW peak of solar PV since 2011; EV and a 1930s house which has been partially renovated to improve its efficiency. 7kW Vaillant heat pump.
02/09/2026 9:14 am
@jon — thanks for posting as you have. You are right to be sceptical when two methods produce different results, either one (or both) are wrong, or the methods are answering different questions, in which case both might be right or wrong! A few more comments.
(1) despite the complexity, the is a very familiar deceptively simple question: what is my heat loss?
(2) there is very little mention of the indoor air temperature (IAT). What this constant throughout the measurement periods? If not, then changes in the IAT will cause changes in energy use.
(3) I'm still unsure whether sufficient distinction is made between energy use (consumed, what shows up on the meter) and energy delivered to the house (what comes out of the emitters). For a boiler the latter will always be less than the former, but for a heat pump the opposite is the case, by a considerable margin (the coefficient of performance, or COP).
(4) periods of dual heat source use will always be trickier to analyse. I suggest the best data may be in the gas only and metered 2015 to 2018 period. But you need ideally hourly if not daily data to do a heat loss from that data. Yet you say "Firstly, I regressed twenty gas meter intervals from 2015 to 2018 against heating degree days computed hourly from ERA5 data at my coordinates." I believe the ERA5 data is hourly, but how localised is it? Is it 'gridded' ie modelled, which might mean it is way out, depending on the grid size, local microclimate effects etc. And why only twenty 'intervals', and what are those 'intervals' (hours, days, weeks, months arbitrary?), and how were they selected? And as @jamespa asked, what does the blob size represent in plot 5?
(5) empirical (ie based on measured energy use/energy delivered to the house, and always ultimately the latter) heat loss determination always potentially trumps whatiffery (spreadsheet) based methods but only if, at the very least, the IAT is constant and the data are both valid (when it says 3kWh were used, 3kWh were used, outside air temp was 10°C when it says it was etc) and are available in sufficient quantity for relatively short intervals (ideally hourly, or daily).
Midea 14kW (for now...) ASHP heating both building and DHW
02/09/2026 10:53 am
I have at least answered my question about the ERA5 data gridding: it is 'regridded', at a horizontal resolution of 0.25° x 0.25° lat/long or 17 x 11 miles but it is based on NWP (numerical weather prediction) methodology which as the weather Johnnies are forever telling us is based on the laws of physics but still manages to get the forecasts wrong, often very wrong, and I have no doubt the same uncertainties apply to the so called ERA5 reanalysis. What is not clear, at least on first glance, is how many observations are used, and where they are taken.
There are other problems. The first is temporal resolution. I think the ERA5 data is probably run every 12 hours - so how do they get the hourly data? The other is the nature of the modelling and gridding means that the effective resolution is more like 4-5 grid lengths, say 75 x 50 miles (or maybe a bit less - but it is still hardly a fine resolution).
What all this means is that the ERA5 data is not observed data, it is in effect a forecast of what the weather was like in the past. The bizzareness of this notion should be more than enough to make one's sceptical muscle twitch.
Midea 14kW (for now...) ASHP heating both building and DHW
1
Page 1 / 4
Next

SPONSORS

Degrees of Separation

Latest Posts
-

RE: Renewables & Heat Pumps in the News
@ashp-bobba I don’t think it would kill the heat pump i...
By Mars , 10 minutes ago
-
RE: Why are ASHP installs so expensive?
@rob-of-york I think the most revealing question here i...
By Mars , 36 minutes ago
-
RE: Does anyone have experience of a smart water meter?
@downfield You are opening a whole can of cans there!
By Toodles , 38 minutes ago
-
RE: Replacing Storage Heaters with a Heat Pump in a Stone Cottage
I found some interesting data about the price of heat p...
By Rob of York , 5 hours ago
-
RE: Air-to-Air Heat Pumps & Air Conditioning: UK Heating and Cooling Q&A
Thanks for that, quite interesting. I liked the bit a...
By springswood , 6 hours ago
-
RE: PV and battery long payback - sense check query
Thanks for all the comments. I finally got to the bott...
By DavidB , 7 hours ago
-
RE: Indevolt Batteries UK Support & Info Thread
People following this thread who are hoping that plug i...
By JamesPa , 17 hours ago
-
Safety study for plug in batteries out to tender - looks like Q3 2027 at best before legal
Whilst searching for other information I came across th...
By JamesPa , 17 hours ago
-
RE: Passiv Smart Thermostat - Help & Forum Support
By Singlespeed , 19 hours ago
-
RE: Help me keep the faith with my air source heat pump installation
just had Vaillant over to service the HP and asked abou...
By AdamK , 19 hours ago
-
RE: tepeo ZEB UK Support & Info Thread
OK so ZEB is basically a variant on a storage heater, b...
By JamesPa , 2 days ago
-
RE: Heat Geek installations: share your experiences
@editor I suspect that the Heat Geek online quote is a ...
By AndrewJ , 2 days ago
-
RE: Adding additional Solar Panels to a DC coupled battery system
Ah, yes. Thanks for clarifying.
By Transparent , 2 days ago
-
RE: Vaillant ecoTEC Plus - Flow Temp and Set Up
@trebor12345 I have been meaning to get home assista...
By Batpred , 3 days ago




SPONSORS
