

Notifications
Clear all
Joining the Renewable Heating Hub forums is completely free and only takes a minute. By registering you’ll be able to ask questions, join discussions, follow topics you’re interested in, bookmark useful threads and receive notifications when someone replies. Non-registered members also do not have access to our AI features. When choosing your username, please note that it cannot be changed later, so we recommend avoiding brand or product names. Before registering, please take a moment to read the Forum Rules & Terms of Use so we can keep the community helpful, respectful and informative for everyone. Thanks for joining!

Topic starter
29/08/2026 4:49 pm
I thought I’d post my recent adventures in heat loss calculations, in the hope that they may be of interest to others embarking on the same.
Over the last few days, I’ve done some heat loss calculation for my house, a 1970's 4-bed detached (146 sqm), which has as much insulation as we could reasonably add without it turning into a full retrofit. As a stubborn and pragmatic scientist, I decided I’d work out the heat loss as far as possible myself from the basics. I used 24 degrees as the design temperature difference (i.e. -3C outside and 21C inside).
I calculated the heat loss in two ways and also tried out a simple estimate:
- Theoretical: based on the attributes of the house (room sizes, construction materials and their U-values etc.).
- Practical: based on the energy going into the house that kept it significantly warmer than outside during December 2024 and January 2025. (I used those months because our only heating system then was a gas boiler).
- Quick estimate: using the Michael De Podesta Formula
1. Heat loss (theoretical):
1a. Thermal conduction: I worked out the areas of the various building components (floors, ceilings, walls, windows etc) on a room-by-room basis and either looked up their U-values from the rdSAP 10 manual or worked them out from the U-values for the individual materials used and their thicknesses. (The open university web pages were useful in that respect, see https://www.open.edu/openlearn/nature-environment/energy-buildings/content-section-3.2.4 and the next few pages). From the various U-values, areas, and the temperature difference, I worked out the heat loss.
The overall thermal conduction losses came to about 3720 W.
1b. Thermal Bridging: This takes account of the joins between walls and roof, walls and floor, windows and walls etc. which tend to be areas of high heat loss. rdSAP 10 accounts for this by increasing the U-values of everything in 1a above by a fixed amount depending on the age of the property, e.g.by 0.15 for my 1970's house.
The overall thermal bridging losses came to about 1180 W
1c. Ventilation Losses: These are given by a simple formula: 0.33 x temp difference x house internal volume x ACH. Where ACH is the number of air changes per hour. Appropriate values for ACH are an area of some debate as they can vary widely for two ostensibly similar houses. As I’ve taken care that my house is well sealed, I used a value of 0.5 for ACH, however, I currently have no hard evidence for that value.
The overall ventilation losses came to about 1340 W
Total theoretically determined heat loss 6240 W
Thermal conduction was 60% of the total, thermal bridging 19% and ventilation losses 21%.
2. Heat loss (practical):
I have a semi-professional weather station in my back garden. The outdoor and indoor units record temperature every 30 minutes, hence I could easily get average indoor and outdoor temperatures for Dec 2024 and Jan 2025 and the average difference in temperature over each of those months.
I then worked out the total heat energy going into the house from the following:
- Gas consumption figures, assuming 0.9 boiler efficiency (condensing except when heating hot water).
- Subtracted gas consumption for hot water heating, since the water is still hot when it drains out of the house.
- Electricity consumption figures, since all use of electricity within the house eventually turns into heat.
- Two people in the house at 100W each for an average of 16 hours per day.
- Solar gains from 10 kWh per sqm incident energy on east and west facing windows over each whole month. (Double glazed unit g-value of 0.49, glass to frame ratio of 0.7, overall window area measured).
Correcting from the actual difference in average indoor and outdoor temperatures gave an input energy of 147.8 kWh per day to achieve a 24-degree temperature difference.
Total practically determined heat loss 6160W
3. Michael De Podesta Formula
The Michael De Podesta Formula is simply annual gas usage divided by 57.3 multiplied by the 24-degree temperature difference.
Total heat loss based on Michael De Podesta Formula 6031W
Thoughts:
The first thing that struck me was that the figures from the two completely different heat loss calculations are surprisingly close. As they are worked out completely differently, this gives me some confidence that they are about right. Further, the simple Michael De Podesta Formula also gives a value that is within 5%.
The ACH value has the most uncertainty and varying that has a big effect. I don't know if there is anything I can do to reduce that uncertainty short of paying for an air tightness test.
There is quite some heat that goes into the house from sources other than the heating system. This amounts to about 570W from non-heating electricity use, people burning calories, and solar gain through the windows even at the dullest time of year.
If I just want the maximum demand on the central heating system, then it looks like this is about 5500 to 5700W, not including hot water heating.
Comments welcome!
2

29/08/2026 9:12 pm
My only comment is well done. You have come at this several different ways and got, perhaps a bit fortuitously, very similar answers. If only heat pump installers did this as standard.
I can't see how you will do much better without making lengthy measurements specifically designed for the purpose, but neither do you need to.
I don't know if you are contemplating a heat pump or already have one but if you are contemplating one this should stand you in good stead.
Many installers will refuse to take any notice, more enlightened ones will note the results and adjust their assumptions accordingly (they have to do a heat loss calculation by mcs rules). I don't think you need us to tell you who to go with if the first group come up with figures that are significantly different, as they may.
My calculations were different, but essentially my heat pump was sized based on measured consumption under conditions known to me and any installer coming up with a materially different figure was politely advised that their offer would not be considered.
This post was modified 1 month ago 3 times by JamesPa
4kW peak of solar PV since 2011; EV and a 1930s house which has been partially renovated to improve its efficiency. 7kW Vaillant heat pump.

29/08/2026 9:21 pm
Hats off, can´t fault it.
In our case, I was most confident with the fact the surveys fell between the gas usage calculated loss. Well, HG´s did after some "tweaking"..
8kW Solis S6-EH1P8K-L-PLUS hybrid inverter; G99: 8kW export; 16kWh Seplos Fogstar battery; Ohme Home Pro EV charger; Vaillant Arotherm Pro 7kW; 100Amp head, HA lab on mini PC
29/08/2026 9:33 pm
In our case, I was most confident with the fact the surveys fell between the gas usage calculated loss. Well, HG´s did after some "tweaking"..
Was the tweaking adjustment of assumptions to fit the facts?
4kW peak of solar PV since 2011; EV and a 1930s house which has been partially renovated to improve its efficiency. 7kW Vaillant heat pump.

29/08/2026 10:18 pm
In our case, I was most confident with the fact the surveys fell between the gas usage calculated loss. Well, HG´s did after some "tweaking"..
Was the tweaking adjustment of assumptions to fit the facts?
yes and no. apparently HG’s AI was automatically assuming massive ventilation losses (and I noticed other posters mentioning the same in their case. So that needed tweaking. But the second iteration of proposals and tweak seemed to be like an override, to input the lose value we had calculated from gas…
I just followed your suggested method. Ask questions until the right answer is written on the heat loss survey!
Apart from that, we were very happy with the HG install and commissioning ..
8kW Solis S6-EH1P8K-L-PLUS hybrid inverter; G99: 8kW export; 16kWh Seplos Fogstar battery; Ohme Home Pro EV charger; Vaillant Arotherm Pro 7kW; 100Amp head, HA lab on mini PC
30/08/2026 7:39 am
As others have said, well done, and thank you for posting such a detailed account of your methods and results.
The first thing that struck me was that the figures from the two completely different heat loss calculations are surprisingly close. As they are worked out completely differently, this gives me some confidence that they are about right.
This is perhaps one of the most significant findings, that two totally independent methods produce, give or take, the same result. As a scientist, you don't need to be told that this is replication of the best kind (because the methods are independent), and it greatly increases confidence in your results.
Midea 14kW (for now...) ASHP heating both building and DHW
Topic starter
30/08/2026 2:24 pm
Thank you all for the positive comments.
I have made a simple spreadsheet that implements the practical heat loss calculation that I hope will be of use to others - see below.
Topic starter
30/08/2026 3:12 pm
I agree that the close alignment of the theoretical and practical heat loss calculations that I did for my house may be rather fortuitous.
However, the biggest area of uncertainty that I had was in the air changes per hour (ACH) value in the theoretical calculation. The house has retrofit double glazed doors and windows installed to a good standard. I have also been diligent in eliminating any drafts that I could find; they were easy to spot with a thermal camera when it was sub-zero outside. I therefore chose ACH = 0.5 as that seemed to be the default for well-sealed modern properties.
Every 0.1 increase or decrease in ACH equates to 268W of heat loss according to the calculations for my house. This is really significant; if a heat loss survey used ACH = 1.0 instead of 0.5, then the overall heat loss would turn out 1340W higher, about 21%.
Digging into this further, it appears that the issue with high ACH values being applied to older properties has been recognised. The Easy MCS website has some information on this stating that:
New air change defaults
The guide will now align with BS 12831-1:2017, which sets simple defaults:
- 0.5 ACH for habitable rooms
- 0.0 ACH for non-habitable rooms
These apply to all homes, regardless of age or construction.
This seems to be a positive step with older homes no longer penalised with unrealistic ACH values that add kWs to the calculated heat loss.
Previously, pre-1996 homes used the following defaults for ACH depending on room type: bedroom 1.0, dining room and living room 1.5, kitchen, hall, and landing 2.0, and bathroom 3.0. I tried these values in my heat loss calculation, and they gave a value of 4415W for ventilation heat loss alone and 9312W in total. This compares to 1340W for ventilation losses and 6420W in total with ACH =0.5. With those previous defaults, I'd need a separate 5kW heat pump just for the ridiculous ventilation losses! I'm glad that issue with the MCS heat loss calculations has/is being fixed.
30/08/2026 5:22 pm
@rob-of-york — thanks for posting this, all very useful and accessible stuff. I particularly like your demonstration of the effects of different ACH values.
There is also some published research (SPAB) which suggests that older houses with solid stone walls can be penalised by wall U-value estimates being too high.
Midea 14kW (for now...) ASHP heating both building and DHW
Topic starter
08/09/2026 2:40 pm
Here is a further method of calculating heat loss, with thanks to @jamespa and @cathoderay for a lively discussion on another thread. (I've posted it here, as it fits with the other heat loss estimates that I have looked at).
This approach is again a practical one, and is based on daily averaged measurement data that it is possible to obtain with a smart meter and a home weather station.
The idea is that in an equilibrium state, the energy going into the house balances the heat leaving the house in any given time interval. Since energy divided by time is power, the equation is:
PM + PO = HTC(IT - OT)
where PM is the Power determined from Measured data, PO is the Power from Other sources, HTC is the Heat Transfer Coefficient and IT and OT are the average Indoor Temperature and Outdoor Temperature respectively over the time interval considered.
HTC is the power required to keep the house 1-degree above the outside temperature, and is measured in Watts per degree (W/C).
The equation can be rearranged to read: PM = HTC(IT - OT) - PO.
If we plot data for PM against (IT-OT) on a graph, then the equation is that of a straight line, with a slope of HTC that crosses the y-axis at a negative value equal to PO.
If we can obtain values for HTC and PO, then we can easily calculate the heat loss for a reference temperature difference, e.g. 24-degrees, representing -3C outside and 21C inside.
Given the daily variation in temperatures and the fact that houses typically have a lot of thermal inertia, a reasonable time interval for each data point is a day.
I have collected daily data for a 6 month period from Oct-24 to Mar-25. This includes gas consumption, electricity consumption, and average indoor and outdoor temperatures from a weather station, with a temperature sensor in my back garden.
The boiler is assumed to work at 90% efficiency, as it always runs condensing except when heating hot water, and all of the electrical energy is assumed to turn into heat with 100% efficiency. I totaled up the daily energy input from gas and electricity in kWh and converted that to a power figure by dividing by 24 hours.
The graph below shows a scatter plot of the 182 data points, along with a regression line.
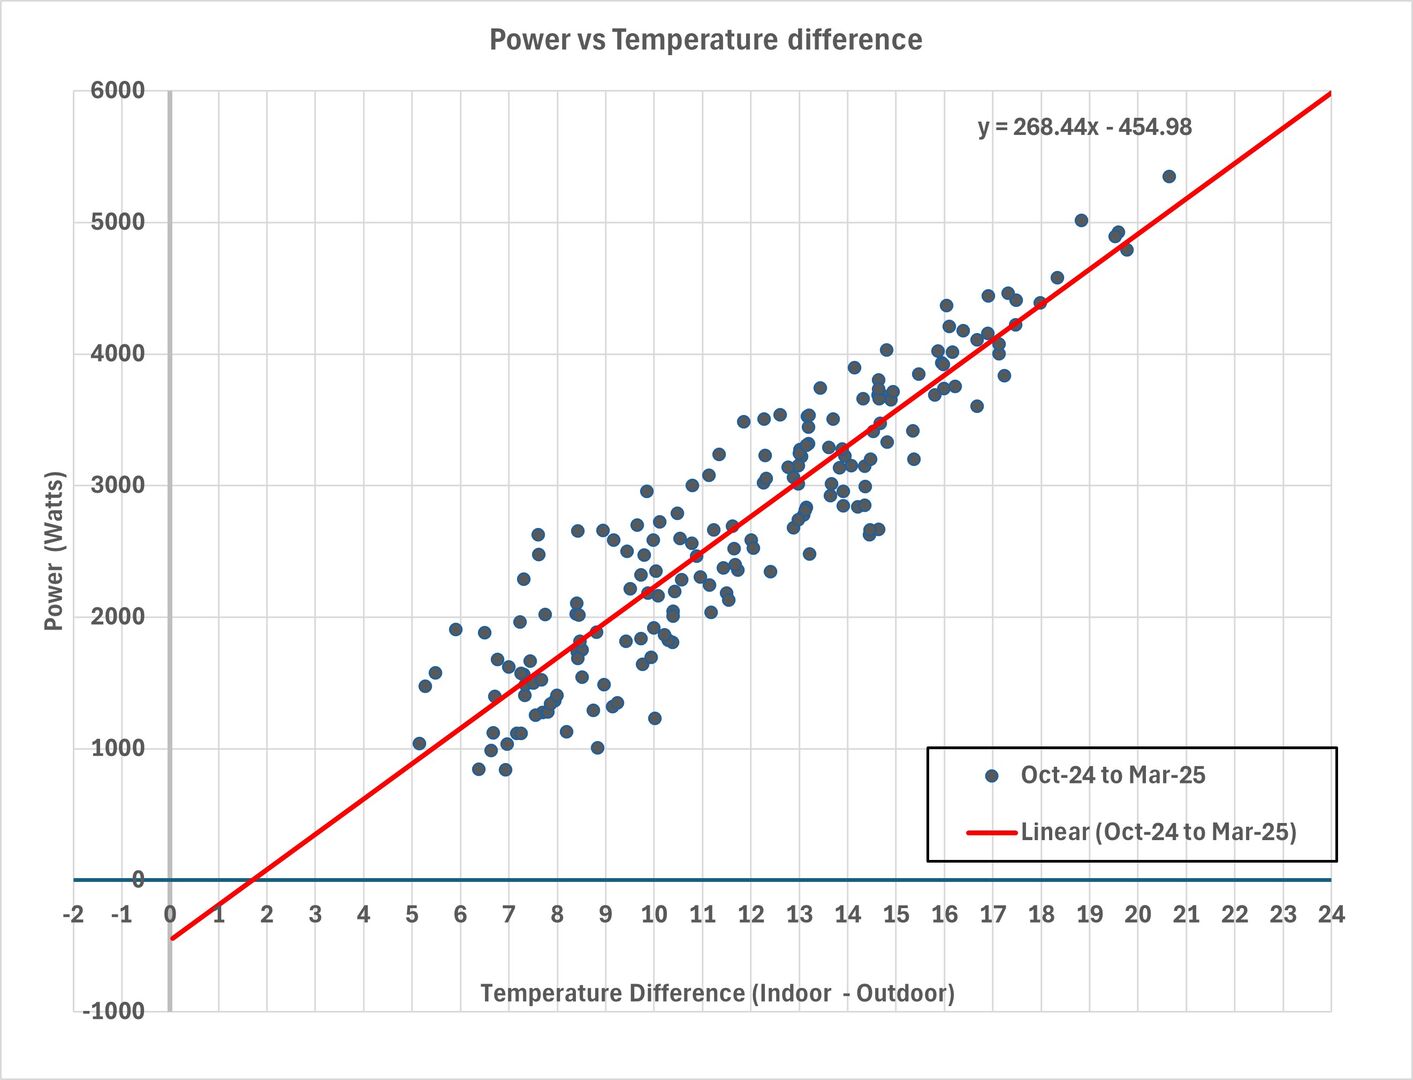
The regression line gives the slope, i.e. HTC, which is about 268W/C and the y-axis intercept, i.e. PO, the power from other sources, which is about 455W.
There is one caveat with this data. I am unable to separate out the gas used for hot water (the heat from which just drains away) from that used for heating and so balances the heat loss from the house. On average, about 150 units of gas are used for hot water in a 31 day month, corresponding to about 180W continuously.
Assuming a 24-degree reference temperature difference, the heat loss works out at (268 x 24) + 455 - 180 = 6260W. This is close to what I obtained via a detailed room-by-room heat loss calculation, described in the first post in this thread.
It took some work to get the smart meter and weather station data in the right format in an Excel spreadsheet, however, there was nothing particularly sophisticated in the information needed or in the processing required.
It would seem that a good estimate of heat loss can be obtained from standard smart meter data, combined with average indoor and outdoor temperatures that simple home weather stations can provide.
[Note, as I have solar PV, I took the electricity consumption from the monitoring app for that, rather than from the smart meter data, since that shows we hardly draw anything from the grid].
1
Topic starter
08/09/2026 3:03 pm
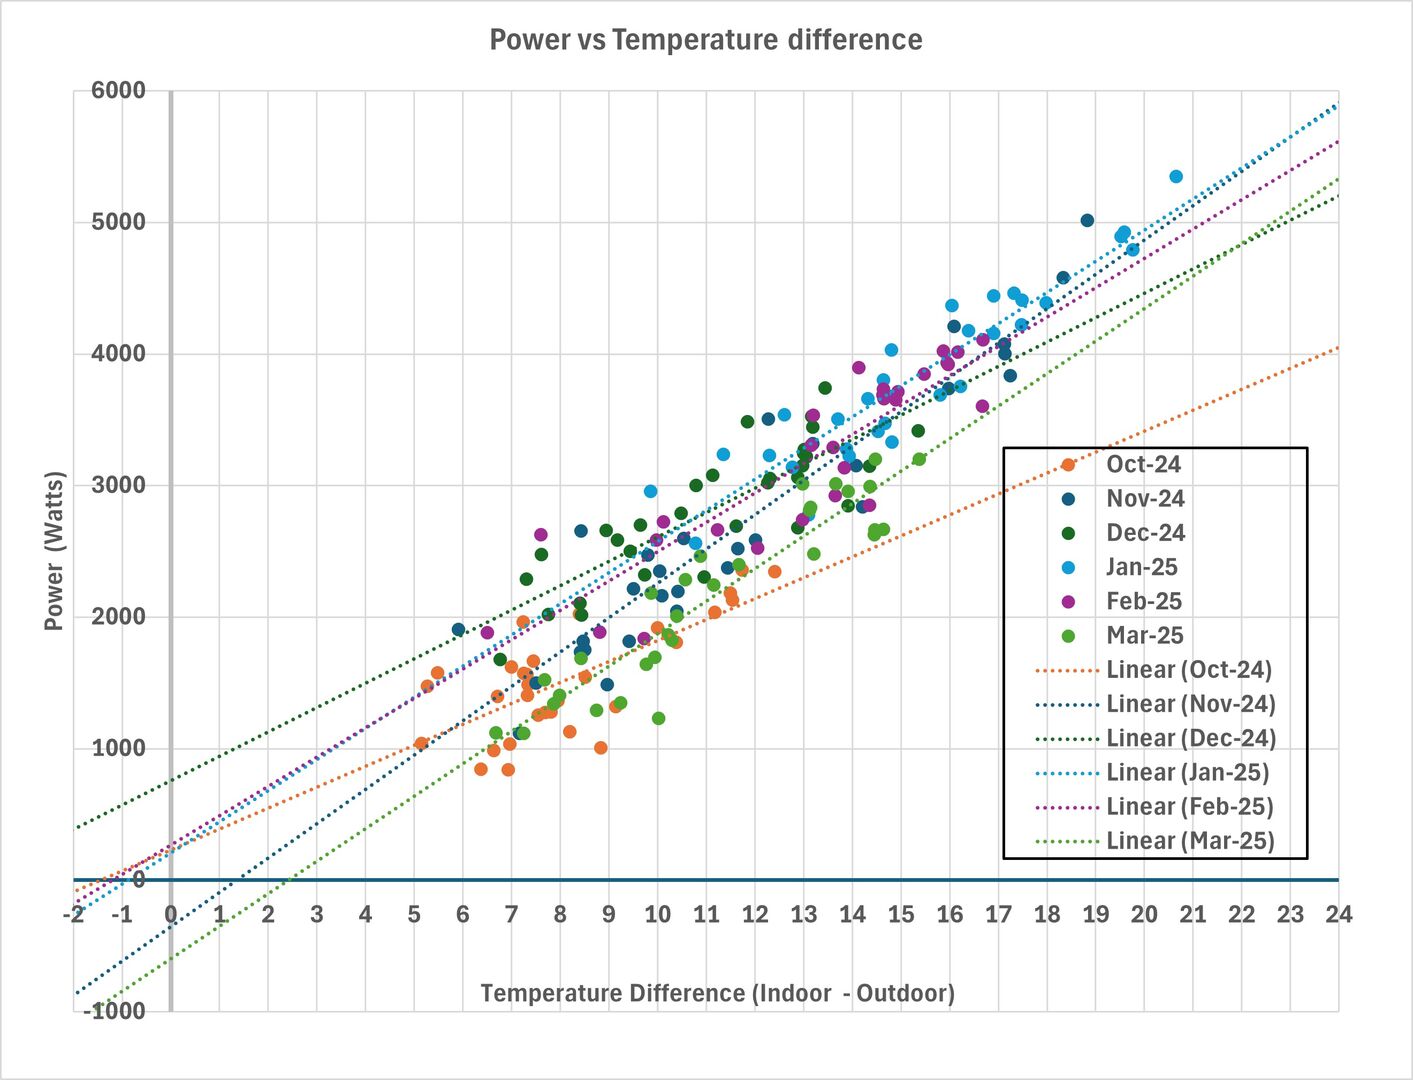
It is interesting to note that while the above graphical method worked very well with a large number of data points, i.e. 182 data points for 6 months, there was too much variation to get good results when using smaller data sets corresponding to individual months.
The graph below shows exactly the same data points as used in the previous post, but now they are divided into individual months and 6 regression lines drawn, one for each month. It is apparent from the large variation in the slope and y-axis intercepts of these lines that 30 or so data points are simply not enough. Where there is only a small variation in temperature differences over the month, for example Feb-24, the extrapolation becomes particularly inaccurate. This problem is avoided with the full data set as the range of temperature differences is much larger (from 5 to over 20-degrees).
In an ideal world, I would be able to look at the same 6-month period over multiple years; however, unfortunately this is the only year where meaningful data exists. During 2023 and summer 2024 we comprehensively upgraded our house's insulation, and then at the end of summer 2025, we had an AC system (air-to-air heat pump) fitted that was used in winter 2025-25 to supplement the gas central heating. The app for the AC system only provides daily data for the past few weeks and rolls previous data up into monthly totals. Hence comparisons with earlier years are meaningless due to changes in the fabric of the building and a comparison with last winter is not possible due to a lack of data.
08/09/2026 3:24 pm
Great data and analysis. Im personally convinced that, intelligently used, this is a sound way to assess heat loss.
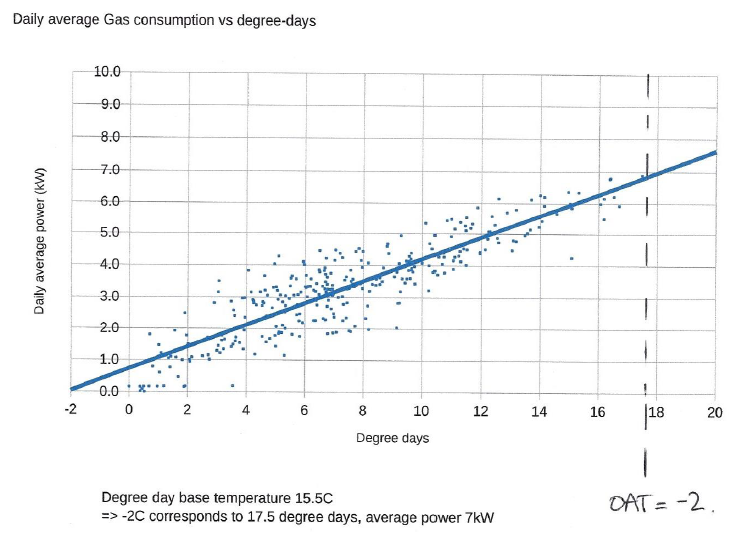
FWIW here is the plot I primarily used to size my heat pump. I didn't have IAT but was pretty confident that it was sufficiently constant. I didn't have OAT either, so used degree days from a nearby weather station. Obviously its much better if you have both! This is two years worth of data and daily resolution derived from half hourly smart meter data. A very similar picture to yours. The positive intercept suggests my base temperature for heating (ie the temperature at which the loss is balanced by extraneous sources) is actually 17.5 not 15.5, which is plausible as there are only 2 in the house and so perhaps only 600W gained from electricity baseload plus people.
This post was modified 1 month ago 3 times by JamesPa
4kW peak of solar PV since 2011; EV and a 1930s house which has been partially renovated to improve its efficiency. 7kW Vaillant heat pump.

Page 1 / 4
Next
SPONSORS

Degrees of Separation
Latest Posts
-

RE: Renewables & Heat Pumps in the News
@ashp-bobba I don’t think it would kill the heat pump i...
By Mars , 13 minutes ago
-
RE: Why are ASHP installs so expensive?
@rob-of-york I think the most revealing question here i...
By Mars , 39 minutes ago
-
RE: Does anyone have experience of a smart water meter?
@downfield You are opening a whole can of cans there!
By Toodles , 41 minutes ago
-
RE: Replacing Storage Heaters with a Heat Pump in a Stone Cottage
I found some interesting data about the price of heat p...
By Rob of York , 5 hours ago
-
RE: Air-to-Air Heat Pumps & Air Conditioning: UK Heating and Cooling Q&A
Thanks for that, quite interesting. I liked the bit a...
By springswood , 6 hours ago
-
RE: PV and battery long payback - sense check query
Thanks for all the comments. I finally got to the bott...
By DavidB , 7 hours ago
-
RE: Indevolt Batteries UK Support & Info Thread
People following this thread who are hoping that plug i...
By JamesPa , 17 hours ago
-
Safety study for plug in batteries out to tender - looks like Q3 2027 at best before legal
Whilst searching for other information I came across th...
By JamesPa , 17 hours ago
-
RE: Passiv Smart Thermostat - Help & Forum Support
By Singlespeed , 19 hours ago
-
RE: Help me keep the faith with my air source heat pump installation
just had Vaillant over to service the HP and asked abou...
By AdamK , 19 hours ago
-
RE: tepeo ZEB UK Support & Info Thread
OK so ZEB is basically a variant on a storage heater, b...
By JamesPa , 2 days ago
-
RE: Heat Geek installations: share your experiences
@editor I suspect that the Heat Geek online quote is a ...
By AndrewJ , 2 days ago
-
RE: Adding additional Solar Panels to a DC coupled battery system
Ah, yes. Thanks for clarifying.
By Transparent , 2 days ago
-
RE: Vaillant ecoTEC Plus - Flow Temp and Set Up
@trebor12345 I have been meaning to get home assista...
By Batpred , 3 days ago





SPONSORS