

Notifications
Clear all
Joining the Renewable Heating Hub forums is completely free and only takes a minute. By registering you’ll be able to ask questions, join discussions, follow topics you’re interested in, bookmark useful threads and receive notifications when someone replies. Non-registered members also do not have access to our AI features. When choosing your username, please note that it cannot be changed later, so we recommend avoiding brand or product names. Before registering, please take a moment to read the Forum Rules & Terms of Use so we can keep the community helpful, respectful and informative for everyone. Thanks for joining!
08/09/2026 5:38 pm
The graph below shows exactly the same data points as used in the previous post, but now they are divided into individual months and 6 regression lines drawn, one for each month. It is apparent from the large variation in the slope and y-axis intercepts of these lines that 30 or so data points are simply not enough.
An excellent description of the problem with small data sets, and thanks for posting all this.
The positive intercept...
...suggests something is wrong, and it can't be explained by the data set being too small, because it isn't! As you said recently of my positive intercept, "IMHO its worth investigating"!
As @rob-of-york put it very succinctly (PM = power measured from the primary heat source, PO = power from other heat sources) :
"The equation can be rearranged to read: PM = HTC(IT - OT) - PO.
If we plot data for PM against (IT-OT) on a graph, then the equation is that of a straight line, with a slope of HTC that crosses the y-axis at a negative value equal to PO."
The only way the offset can be positive in the real world is by the other power sources, instead of contributing extra heat, act to suck heat out of the building. Aliens might be able to do that, but we humans can't, likewise the energy that comes out of a socket to boil a kettle goes into the kettle, and then the house, not the other way round. We both need to explain our positive intercepts.
I'm making progress tidying up my disorganised files, and am trying to find the cleanest and most adaptable way of getting 24h data for plots using daily data. At the moment I stuck trying to explain the albeit small discrepancies in the 24h totals and averages that arise when different methods are used. Since the underlying data is the same, the results should be the same.
Midea 14kW (for now...) ASHP heating both building and DHW

08/09/2026 5:58 pm
The positive intercept...
...suggests something is wrong, and it can't be explained by the data set being too small, because it isn't! As you said recently of my positive intercept, "IMHO its worth investigating"!
Because the plot is against degrees days not OAT, with an assumed base of 15.5, this is most likely an indication that my house has a base a bit higher. Eyeballing the intercept suggests 17.5. Of course it could be something else but a base of 17.5 is very plausible.
4kW peak of solar PV since 2011; EV and a 1930s house which has been partially renovated to improve its efficiency. 7kW Vaillant heat pump.

Topic starter
08/09/2026 6:36 pm
I'm inspired to try out the degree days approach using my data.
Gas only power
Going step by step, first I've taken the electricity usage out, so looking at gas-only power vs. temperature difference.
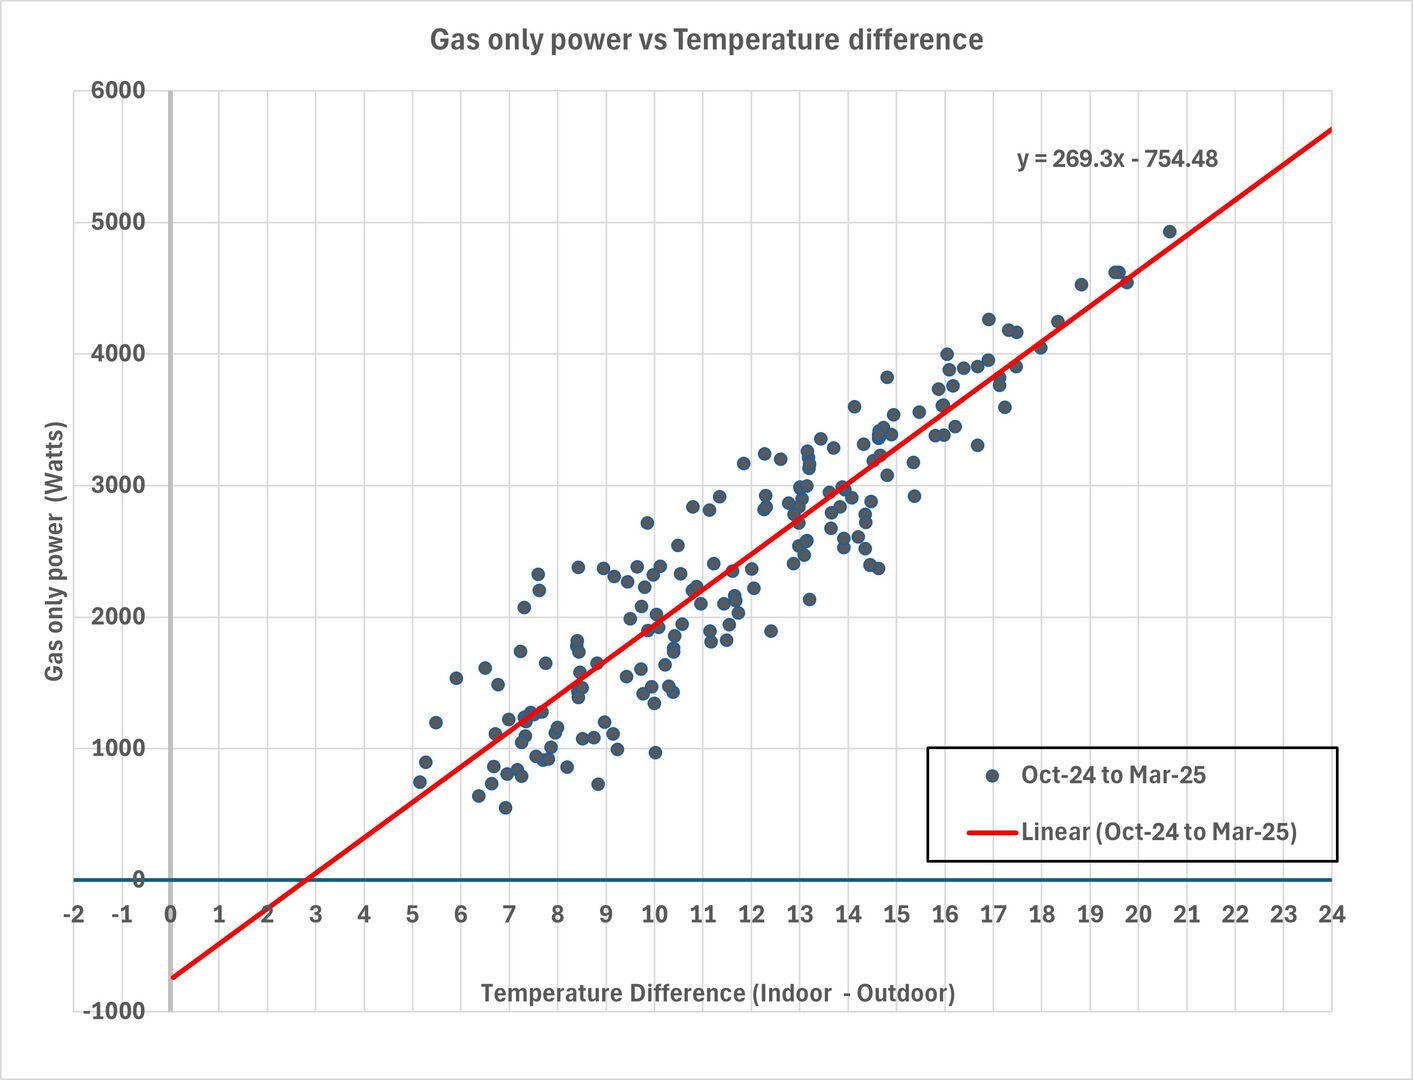
This changed HTC (the slope) by a tiny amount, now 269W/C rather than 268W/C, definitely in the noise, but increased the power from other sources from 455W to 755W, so 300W extra. It turns out my average electricity usage was 290W over the 6 month period, so that correction is pretty much spot on for what has been removed. The estimated heat loss from gas-only power vs. temperature difference is (269 x 24) + 755 - 180 = 6280W, only 20W different from before, again in the noise.
A useful conclusion from this is that if electricity usage is relatively low (our average is 6.9kWh per day) and follows a fairly steady weekly average, then including it is not necessary to obtain a good heat loss estimate. Our daily electricity consumption varied between 3.9 kWh and 13.8 kWh, but that variability does not seem to have impacted the results when a gas-only view is taken.
Degree days
Second, I switched to using degree-days on the x-axis, where the degree-day value is 15.5C minus the average outdoor temperature for the day.
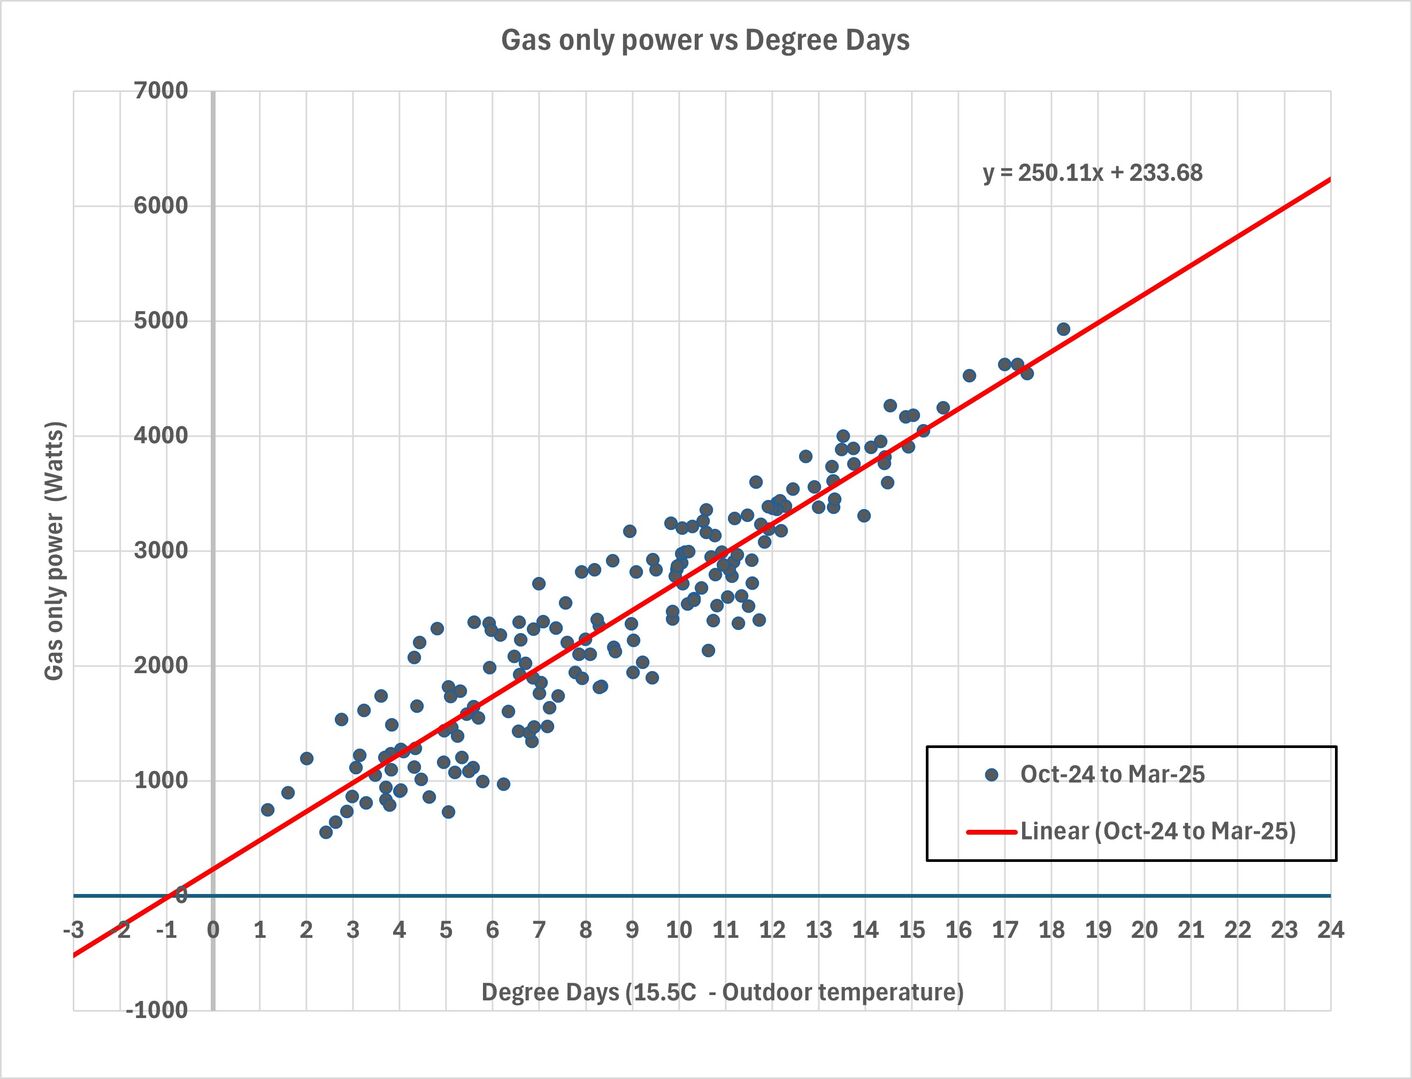
Now the HTC value (the slope) has changed to 250W/C. The x-axis intercept is close to -1C, suggesting that no gas heating is required once the outdoor temperature reaches 16.5C. The overall average indoor temperature was 18.5C, hence a degree days value of -3C is the point at which the outdoor temperature matches the average indoor temperature. The regression line crosses the x = -3C vertical line at a value of -520W. Hence, the power from other sources is estimated at about 520W.
The estimated heat loss from gas-only power vs. degree days is (250 x 24) - 234 - 180 = 5820W, somewhat lower than before.
This graph is interesting because if the indoor temperatures were absolutely constant at the 18.5C average, then the points and the lines on the two graphs above would look identical, there would just be a 3-degree shift in the x-axis values. In fact, the daily average indoor temperatures varied from 17.6C to 20.0C, and there is a correlation between lower outdoor temperatures and lower indoor temperatures. This is mainly because we do not run the heating overnight, and so while the indoor temperature is relatively stable during the day, it drops by a variable amount at night depending on the outdoor temperature. (The 91 days with the lowest outdoor temperatures have an overall average for the indoor temperature of 18.3C, compared to 18.8C for the other 91 days with the highest outdoor temperatures). This small difference would appear to be enough to shift the slope of the regression line, which is reducing the estimated heat loss.
In conclusion, if indoor temperatures can be held very stable, for example by running the heating system 24/7, then good heat loss estimates could still be obtained without the need for indoor temperature information. However, if average indoor temperatures correlate with outdoor temperatures, for example because the heating system switches off over night, then the small differences will likely impact the quality of the heat loss estimate.
I would encourage anyone looking to make an accurate estimate of heat loss based on measurements over the 2026/27 heating season to invest a small amount of money in their own weather station, allowing indoor and outdoor temperatures to be recorded on a frequent basis (at least hourly).

08/09/2026 6:44 pm
@rob-of-york Hi Rob,
we paid ~£350 for an air leakage test and it was worth every penny. It gave our installer hard evidence to not use the MCS default values so saved us the 30% uplift in pump size we would have ‘needed’. Also the tester kept it running while we went round the house closing the doors to each room in turn to find where the residual leaks were.
In our case it was not the classic under-bath or kitchen work-top holes into the cavity or outside but where pipes used to go into the roof space. We had not filled the ‘whole of the hole’. With this guide we blocked more leaks.
I found the most unknown of heat loss values was air leakage and after the measurement at 50pA the next unknown was the de-rating based on wind exposure and protection from surrounding trees and houses. We live half way down a west-facing hill so we’re sheltered one direction but not the others. Wind-chill in driving south-westerly rain is very noticeable here.
This post was modified 2 months ago by Judith
2kW + Growatt & 4kW +Sunnyboy PV on south-facing roof Solar thermal. 9.5kWh Givenergy battery with AC3. MVHR. Vaillant 7kW ASHP (very pleased with SCOP >4) open system operating on WC

Topic starter
08/09/2026 6:52 pm
I think a positive y-axis intercept is not necessarily an indication that something is wrong when the x-axis values are degree days, i.e. 15.5C minus outdoor temperature. If the indoor temperature is say 18.5C, then it is degree days = x = -3C value that represents the point at which outdoor and indoor temperatures are equal. Hence, in this case the intercept between the regression line and the vertical line at x=-3C gives the power from other sources. That intercept should be negative, indicating a positive contribution.
@jamespa roughly what was your average indoor temperature? Assuming it was 18C or more then where the regression line intercepts x = 15.5 - average indoor temperature would be at a negative power value, which is fine. The main concern would be how much indoor temperatures are influenced by outdoor temperatures, since that could pull the slope of the regression line down somewhat underestimating heat loss.
Topic starter
08/09/2026 7:08 pm
Thanks for the advice on an air leakage test. It's definitely on the list for the two reasons that you suggest: finding leaks and also having real data to give to installers rather than letting them use estimates. I also want to make my own heat loss calculations as accurate as possible, and having a measured ACH value will definitely help with that.
On really cold days, a thermal camera is good for finding leaks. I found a couple of sheltered corners in the house where the air temperature was close to zero when it was -5C outside despite the indoor temperature being close to 20C. Both cold spots were due to air leaks that I subsequently plugged. I plan to take another look this winter and see if I can find anymore, and once I've done that get an air leakage test.
There are now updated CIBSE guidelines that should hopefully mean installers no longer use crazy defaults for ACH:
The guide will now align with BS 12831-1:2017, which sets simple defaults:
- 0.5 ACH for habitable rooms
- 0.0 ACH for non-habitable rooms
These apply to all homes, regardless of age or construction.
08/09/2026 8:12 pm
I think a positive y-axis intercept is not necessarily an indication that something is wrong when the x-axis values are degree days, i.e. 15.5C minus outdoor temperature. If the indoor temperature is say 18.5C, then it is degree days = x = -3C value that represents the point at which outdoor and indoor temperatures are equal. Hence, in this case the intercept between the regression line and the vertical line at x=-3C gives the power from other sources. That intercept should be negative, indicating a positive contribution.
@jamespa roughly what was your average indoor temperature? Assuming it was 18C or more then where the regression line intercepts x = 15.5 - average indoor temperature would be at a negative power value, which is fine. The main concern would be how much indoor temperatures are influenced by outdoor temperatures, since that could pull the slope of the regression line down somewhat underestimating heat loss.
Agree with the first paragraph (I said roughly the same above).
Average indoor temp probably about 20-21C but I cant be absolutely sure. The data was from two seasons, in the first I switched off 10.30pm - 6am (but it didn't cool more than 2-3 degrees), in the second the heating was on 24x7.
Agree with the risk of pulling down the regression line. However provided the actual IAT at the min OAT is not too far out (which I knew it wasn't because I wasn't cold) the calculated consumption at that value (which is what matters) wont change too much (the slope will reduce but the offset will increase). Faced with (early) 'professional' surveys that were saying 16kW, and my own survey at the time, using MCS default ACH values, saying 10.5kW, I needed a measurement of some kind and you have to use what you have, not what you would ideally like.
I also checked peaks of gas usage averaged over 3, 6, 12 hrs (see attached) to be reasonably certain and subsequently capped my boiler at 8.5kW for a season, which is the minimum it would go to.
With a bit of thought I was able to rationalise all the data (and adjust my own survey assumptions) and conclude the loss was ~7kW. By then I had encountered more enlightened installers who told me that ACH was generally overstated, and who managed to do a calculation according to MCS rules but adjusting ACH, coming out at 6.5-7kW.
Not a perfect series of measurements I admit, but good enough to convince me that the (small) risk that the Vaillant '7kW' would be undersized was tolerable. In the end the purpose of the measurement is to resolve key design decisions and it has only to be good enough to do that. This did the job so was 'good enough'.
There are now updated CIBSE guidelines that should hopefully mean installers no longer use crazy defaults for ACH:
The guide will now align with BS 12831-1:2017, which sets simple defaults:
- 0.5 ACH for habitable rooms
- 0.0 ACH for non-habitable rooms
These apply to all homes, regardless of age or construction.
That will make a massive difference and hopefully put an end to gross oversizing.
This post was modified 2 months ago 7 times by JamesPa
4kW peak of solar PV since 2011; EV and a 1930s house which has been partially renovated to improve its efficiency. 7kW Vaillant heat pump.
09/09/2026 9:50 am
This thread being the more generic one is I think the best place for this post.
I have now plotted my data from 1st Jan 2026 to the end of the heating season, 27th April 2026, n=117, plotting daily mean hourly values for energy delivered to the house against IAT-OAT. By daily mean hourly values I mean each data point represents the mean of the hourly values for a particular day.
The data comes from a cleaned and tidied copy of my hourly data. Cleaned and tidied means missing rows eg during power cuts added back using mean values from those either side, bizarre values (very rare but they happen) made reasonable etc. I used the hourly data because it has all the necessary columns, and has been subject to less 'data wrangling' than the 24 hour data.
In the end, I found using sql (via 'q text as data') was the easiest way to get the data. Pivot tables are all very well, but sometimes they can screw things up (or perhaps I press the wrong buttons), and they are something of a black box (you can't actually see how they work, you just get 'results'). On the other hand, SQL is totally transparent. I also manually checked (by calculation from the raw data) some of the returned results, and they were correct. For each of the four months (by changing the 2026-01 string) at the start of 2026 I used (I have added line breaks for clarity, in use it is one long line):
q -H -d , "select DATE(datetime) as 'date',
sum(ambient)/24,sum(MD02_tmp)/24,
sum(MD02_tmp)/24-sum(ambient)/24,
sum(htg_kWh_out)/24 from
midea_hr_data_all_to_10_May_26_no_missing_rows.csv
where datetime like '2026-01-%'
group by date
order by date" | clip
Note that because the data is 'trailing data' ie the data recorded at each hour is the data for the previous hour, the data recorded at day x 00:00:00 is actually the preceding day's last hour of data, and as result the days run 2300h to 2300h, but I do not think this matters one jot, so long as the 'days' are 24 hour periods.
The 'q -H -d ,' at the start is the command, run q.exe, data has headers, delimiter is a comma. Ambient is the hourly mean OAT, MD02_tmp is the hourly mean IAT (both calculated from the minute data). Energy out is htg_kWh_out and this is all energy out directed towards space heating, even the small amounts at the end of a mainly DHW hour, which after all are space heating kWhs. Doing this also means each daily collection of data always has 24 values, so I can simply sum and divide by 24 (sql can do this, see the code) to get the daily means. The '| clip' at the end copies the data to the clipboard so I can copy it wherever I want to copy it. I then plotted the daily means (energy delivered to the house against IAT minus OAT) and this is what I got:
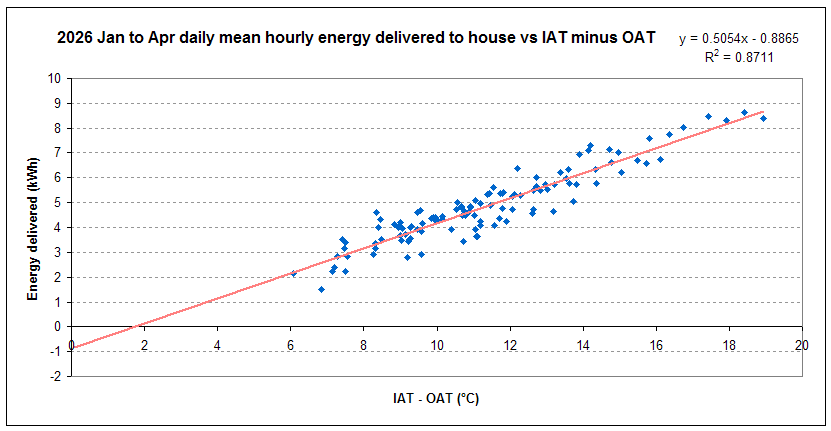
This now shows a much more credible negative Y intercept, confirming, as @rob-of-york has already found, a month's data is insufficient, you need several months to get credible results. The gradient, which is the HTC, is 505W/C, which is again credible given I have an old leaky building. The Y intercept, the inferred heat from other non-primary heat sources is 886W, which seems a little high, but that may be in part because the DHW cylinder, despite being new and supposedly well insulated, is itself quite leaky (of heat, not water!), the DHW loses about 10°C over 24 hours even with minimal use, and that heat will end up in the house, but isn't counted in the data behind the chart. The left censorship (no values below IAT-OAT of 6°) fits with my practice of typically turning the central heating on or off when the mean OAT is around 14°C (20° IAT - 14° OAT = 6°), but it does mean a fair bit of left extrapolation (which @jamespa is prone to remind me is something I usually warn against, but there is a reasonable assumption that the trend is a linear trend) to get the Y intercept. Using the heat loss formula, heat loss = HTC x delta t between IAT and OAT at design temps (-2°C OAT), I get 505W/C x 21 (or 22 for an IAT of 20, which my IAT often settles at) = 10605W (or 11110W for an IAT of 20), lets say something in the middle, 10.8 kW. This is higher than my OAT based plots suggest (around 9.5 kW), but is it more accurate? My heat pump only really starts to struggle when the OAT is below the design OAT, see early hours of 6th Jan 2026 (LWT = Leaving Water Temp, RWT = returning Water Temp):
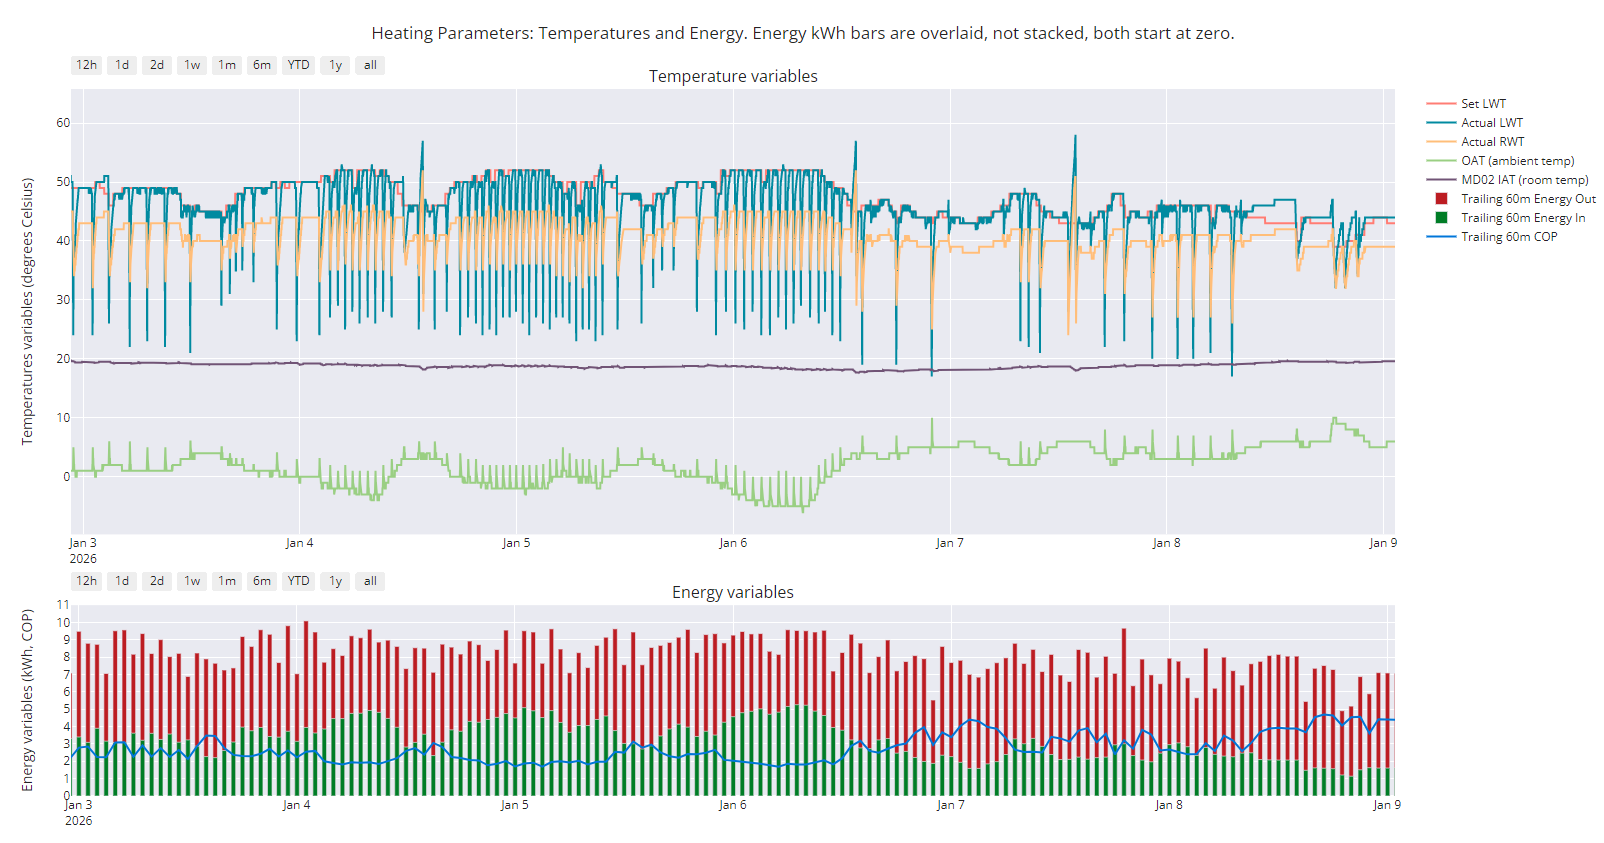
And even then , despite some defrost panic, the IAT drop is only a degree or so, and the hourly kWh use (and so kW rating at the time) is around 9.5 kWh. But this is with the Set LWT (set in turn by the WCC) set to 52°C, I may have a bit of reserve there, perhaps up to 55°C at -4° OAT. Midea claim their 14kW unit can put out just over 11kW at these OATs.
Midea 14kW (for now...) ASHP heating both building and DHW
1
09/09/2026 11:03 am
Using the heat loss formula, heat loss = HTC x delta t between IAT and OAT at design temps (-2°C OAT), I get 505W/C x 21 (or 22 for an IAT of 20, which my IAT often settles at) = 10605W (or 11110W for an IAT of 20), lets say something in the middle, 10.8 kW. This is higher than my OAT based plots suggest (around 9.5 kW), but is it more accurate? My heat pump only really starts to struggle when the OAT is below the design OAT, see early hours of 6th Jan 2026 (LWT = Leaving Water Temp, RWT = returning Water Temp):
Great work.
Have you subtracted the fixed contribution from the final figure. Remember the loss is what the house loses to the outside world, the heating system has to supply loss-fixed contribution from other appliances etc.
9.5kW vs 10.5kW are within 10%, about as close as we are likely to get IMHO. Whilst, in principle, this is an exact science, the unknowns and uncontrolled variables mean that in practice it isn't, except possibly in that warehouse in Salford.
This post was modified 1 month ago by JamesPa
4kW peak of solar PV since 2011; EV and a 1930s house which has been partially renovated to improve its efficiency. 7kW Vaillant heat pump.
09/09/2026 11:43 am
Great work.
Have you subtracted the fixed contribution from the final figure. Remember the loss is what the house loses to the outside world, the heating system has to supply loss-fixed contribution from other appliances etc.
Thanks. No, I forgot to do that. But don't we add it when using IAT - OAT rather than degree days? The plotted line shows what the heat pump supplies, and needs to supply, but isn't there another unplotted line above it which is the heat pump heat plus the other non-heat pump sources, which is the total heat loss, balanced by the heat plus the other sources of heat, that passes through the origin? See this paragraph from above, which is an IAT-OAT based plot:
This changed HTC (the slope) by a tiny amount, now 269W/C rather than 268W/C, definitely in the noise, but increased the power from other sources from 455W to 755W, so 300W extra. It turns out my average electricity usage was 290W over the 6 month period, so that correction is pretty much spot on for what has been removed. The estimated heat loss from gas-only power vs. temperature difference is (269 x 24) + 755 - 180 = 6280W, only 20W different from before, again in the noise.
You can see the 755W from other sources is added, not subtracted, from (HTC x delta t), though I have to confess I am not sure what the - 180 represents, or where it comes from.
In contrast, with a degree-days based plot, the contribution from other sources is subtracted:
The estimated heat loss from gas-only power vs. degree days is (250 x 24) - 234 - 180 = 5820W, somewhat lower than before.
I'm still getting my head round the logic, so I may be completely wrong.
Midea 14kW (for now...) ASHP heating both building and DHW
09/09/2026 11:51 am
Great work.
Have you subtracted the fixed contribution from the final figure. Remember the loss is what the house loses to the outside world, the heating system has to supply loss-fixed contribution from other appliances etc.
Thanks. No, I forgot to do that. But don't we add it when using IAT - OAT rather than degree days? The plotted line shows what the heat pump supplies, and needs to supply, but isn't there another unplotted line above it which is the heat pump heat plus the other non-heat pump sources, which is the total heat loss, balanced by the heat plus the other sources of heat, that passes through the origin? See this paragraph from above, which is an IAT-OAT based plot:
Again it depends on what you are calculating from what starting point.
For example in this calculation
Using the heat loss formula, heat loss = HTC x delta t between IAT and OAT at design temps (-2°C OAT), I get 505W/C x 21 (or 22 for an IAT of 20, which my IAT often settles at) = 10605W (or 11110W for an IAT of 20), lets say something in the middle, 10.8 kW.
The multiplication correctly calculates the loss, but the energy that the heat pump must supply is that minus the heat supplied by other sources. This comment would apply whether the HTC (ie the gradient of the power vs temperature line) is calculated from degree days or DT.
4kW peak of solar PV since 2011; EV and a 1930s house which has been partially renovated to improve its efficiency. 7kW Vaillant heat pump.
Topic starter
09/09/2026 12:18 pm
I'm pleased to see that your cleaned up data gives consistent results. It's great to see this analysis working in practice.
Plotting power against temperature difference is always going to be more accurate than using degree days, since the later is really just an approximation of the former that assumes the indoor temperature is fixed. Any variability in indoor temperature therefore leads to some additional inaccuracy in the heat loss estimation that isn't present when using temperature differences.
Assuming that your heat pump is putting out 9.5kW and there is around 890W from other sources, that's about 10.4kW, which is close to the estimated heat loss at your design temperature. The fact that your heat pump starts to struggle, i.e. doesn't quite put out enough heat when the outside temperature goes below the design value of -2C is further evidence that this heat loss estimate is about right.
It's interesting that we are talking a few hundreds of Watts differences here, when many theoretical heat loss estimates differ by a few kilo-Watts.
One of the best cost-benefit insulation upgrades that we did was to cover our hot water tank in three extra layers of rock wool in some heavy duty plastic jackets. I worked out this saved about £40 per year in gas consumption and cost less than that to do, payback period less than a year! The tank already had hard foam insulation, but was still losing quite a lot of heat. The minor downside is that the airing cupboard is now much cooler and clothes need to stay in there for longer to completely dry.
You could estimate the heat lost from your hot water tank and hence the power that it is putting out as heat. For example 200 litres of water dropping 10C in temperature is 4.2kJ x 200 litres x 10 degrees / 3600 = 2.33kWh, which in 24 hours is about 100W. The 890W from other sources is fairly high, but still plausible. You could look at your average daily electricity consumption excluding the heat pump and see what that is contributing, and also the contribution from people at about 100W for each person when they are present.
1


SPONSORS

Degrees of Separation
Latest Posts
-

RE: How will removing the standing charge on gas bills benefit heat pumps?
I'm not sure it makes much of a difference to heat-pump...
By Temperature_Gradient , 6 hours ago
-
@editor Ouch, sorry to re start the tick. I had assume...
By DavidB , 7 hours ago
-
RE: Say hello and introduce yourself
@e-a-west as the good Major said, welcome to the forums...
By Mars , 8 hours ago
-
RE: New Build 3 Phase or 1Phase
We are on three phase power because it's an enormous li...
By EtchedPixels , 9 hours ago
-
RE: How much of your renewable and home setup would still work if the internet went down?
Yes I actually have a copy of a tool that whenever a ce...
By EtchedPixels , 18 hours ago
-
RE: Indevolt Batteries UK Support & Info Thread
@editor Hi, To resolve this, please tap on the A...
By Indevolt Tech , 1 day ago
-
RE: Double or Triple Glazed Windows?
Posted by: @singlespeed With 9 years repairing windo...
By Rob of York , 2 days ago
-
@transparent we’re still running a secure version of PH...
By Mars , 2 days ago
-
RE: How quickly would you want/expect heat recovery to take from setback?
Much longer than that here. The heating isn't even on. ...
By bobflux , 2 days ago
-
RE: Passiv Smart Thermostat - Help & Forum Support
Obviously the weather is changeable but there's a defin...
By Singlespeed , 3 days ago
-
RE: The Changing Jet Stream Could Challenge UK Air Source Heat Pumps
@rob-of-york I must admit that when we had a Daikin hea...
By Toodles , 3 days ago
-
RE: Forum updates, announcements & issues
Get the Renewable Heating Hub heads-up on WhatsApp. I...
By Mars , 3 days ago
-
RE: Safety study for plug in batteries out to tender - looks like Q3 2027 at best before legal
@editor I pointed out to the one of the Fuse execs that...
By dansus , 3 days ago
-
RE: 15kw pump for 225m2 1990's house - over kill?
@seaviews As well as loft insulation, there are othe...
By Rob of York , 3 days ago




SPONSORS