

Notifications
Clear all
Joining the Renewable Heating Hub forums is completely free and only takes a minute. By registering you’ll be able to ask questions, join discussions, follow topics you’re interested in, bookmark useful threads and receive notifications when someone replies. Non-registered members also do not have access to our AI features. When choosing your username, please note that it cannot be changed later, so we recommend avoiding brand or product names. Before registering, please take a moment to read the Forum Rules & Terms of Use so we can keep the community helpful, respectful and informative for everyone. Thanks for joining!
Air Source Heat Pumps (ASHPs)
38
Posts
6
Users
14
Reactions
1,688
Views

Topic starter
02/09/2026 10:40 pm
Do you have a source reference to Viessman's manuals where this approach is described by them?
The Vitotronic 200 WO1C control unit manual can be downloaded here (link will download the PDF manual): Viessmann Manual
The relevant descriptions are on page 28 (External Heat Generator) and pages 193-197
but where is the sensor which provides that temperature information to the boiler?
Is that mechanism an integral part of the Viessmann firmware within the heat-pump?
Or is it in a separate "dual fuel" control box which has its own temp sensor?10-mins sounds a very long time interval over which the boiler will continue to operate, especially when the heat-pump is already known to be operating inefficiently.
The mechanism is an integral part of the Viessmann firmware within the heat pump control unit. And yes I agree - I think the default is 20 minutes so I already reduced it, but it sounds like I should reduce it even further.
03/09/2026 9:46 am
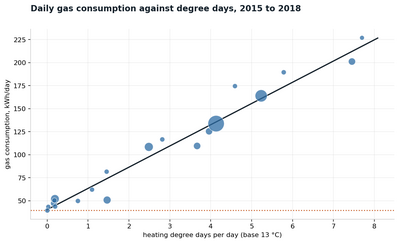
@jon — I think you may already have a good estimate of the heat loss, and it is in, or rather can be derived from, this chart:
First the good points:
(1) it covers a period when there was only one heat source
(2) the correlation is good
(3) it uses the standard methodology, plot energy against outside air temp or heating degree days
The not so good points:
(1) base 13 is a bit low, 15 or 15.5°C is more common, but as the correlation is so good we might, for now, reasonably extrapolate the line a bit, pending further data
(2) the variable blob size doesn't really add anything, and has the spurious effect of making some blobs look more important than the others when they are not (in fact, they might be worse, see next point). Just because you can vary the blob size doesn't mean you should vary the blob size (or make the chart a 3D chart, or fluorescent and animated, or whatever the silly software allows or even encourages you to do).
(3) the intervals over which the means are calculated are generally rather large. In theory, this shouldn't matter, hourly means vs hourly means should give the same result as daily means vs daily means as several day means vs several day means, but there will be a point where we start to lose information. Take the extreme example of a season's mean vs a season's mean, one data point, and no line!
(4) there are no low OAT measurements
However, as the correlation is so good, I think we can run with what the chart tells us as an interim assessment, as long as the IAT was steady during the measurement periods. You will have the regression equation, and can calculate the exact number, but by visually extrapolating to 17 HDDs (minus 1.5°C outside all day at a base of 15.5, which is about what Farnborough from degreedays.net had on the 4th of January this year) I get a daily energy use of around 430 kWh. Correct that for gas boiler 90% efficiency (387 kWh delivered to the house) and make another correction for DHW use (guessing here given the above points, say 5 kWh/day, which is still a lot) and we get 382 kWh/day, or 16 kWh/hour ie a heat loss of 16 kW at design temperatures.
Note this is a provisional figure, it needs to be checked against more recent data using one heat source and maintaining a steady IAT, and most importantly, colder days, to confirm the trend remains linear. Defrost cycles if using a heat pump are taken care of using this method, the COP may fall alarmingly, but if you measure the energy delivered to the house (see also note below) that number is, as it were, net of defrost inefficiencies. It also needs reviewing to make sure I haven't made any silly mistakes!
I also agree with @jamespa, using compressor frequency as a proxy for heat pump energy delivered to the house is not ideal, better to use the standard delta t x flow rate x specific heat capacity formula, despite the potential errors in measurements, they are usually 'good enough', and if need be can be independently verified.
Midea 14kW (for now...) ASHP heating both building and DHW

03/09/2026 10:36 am
@jon — I think you may already have a good estimate of the heat loss, and it is in, or rather can be derived from, this chart:
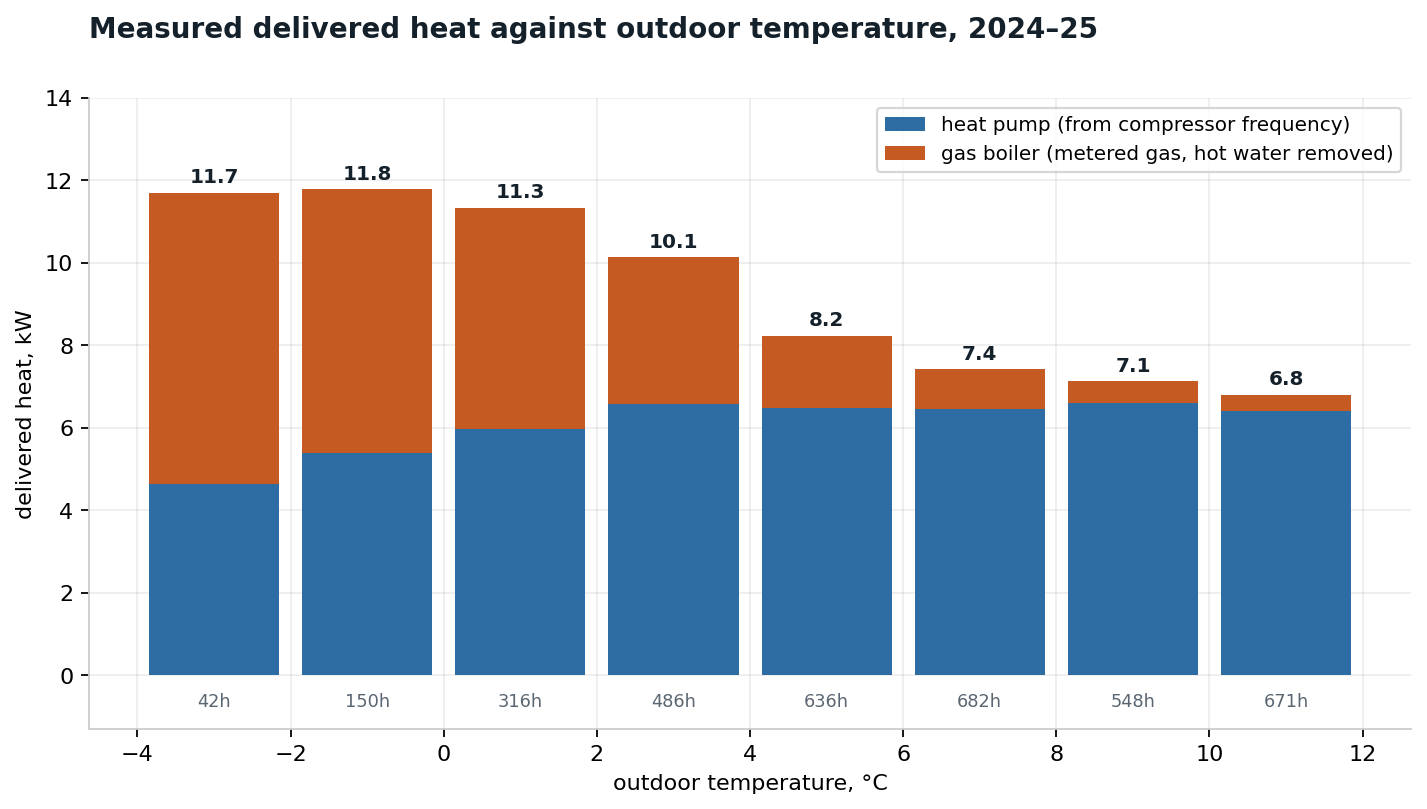
I would agree with this if it were not for the material discrepancy with this graph (the flattening off of which at low temperatures can be explained - see above). This makes me rather nervous about relying 100% on either, which is why I would personally either design and implement assuming that there is a significant uncertainty, or make some well thought through and carefully monitored measurements in the forthcoming season.
 ?x30498
This post was modified 1 month ago 4 times by JamesPa
4kW peak of solar PV since 2011; EV and a 1930s house which has been partially renovated to improve its efficiency. 7kW Vaillant heat pump.
03/09/2026 10:52 am
@jamespa — this chart is indeed suspect, it suggests the energy delivered at low OATs flat lines, which is highly unlikely - unless perhaps some sort of ceiling has been reached, in which case the corresponding IATs should fall. There is also the problem of using compressor frequency as a proxy for energy delivered.
I agree, if it was me, I would do some 'some well thought through and carefully monitored measurements in the forthcoming season' to increase confidence in the results. I have a hunch that it might be the case that the actual heat loss can be managed by one of the larger heat pumps on its own, which makes everything much simpler.
Midea 14kW (for now...) ASHP heating both building and DHW
1


03/09/2026 1:40 pm
A calibrated heat meter is an option, it is not cheap, but it is still much less expensive than choosing the wrong heat pump...
3
Topic starter
03/09/2026 7:26 pm
(2) the variable blob size doesn't really add anything, and has the spurious effect of making some blobs look more important than the others when they are not (in fact, they might be worse, see next point). Just because you can vary the blob size doesn't mean you should vary the blob size (or make the chart a 3D chart, or fluorescent and animated, or whatever the silly software allows or even encourages you to do).
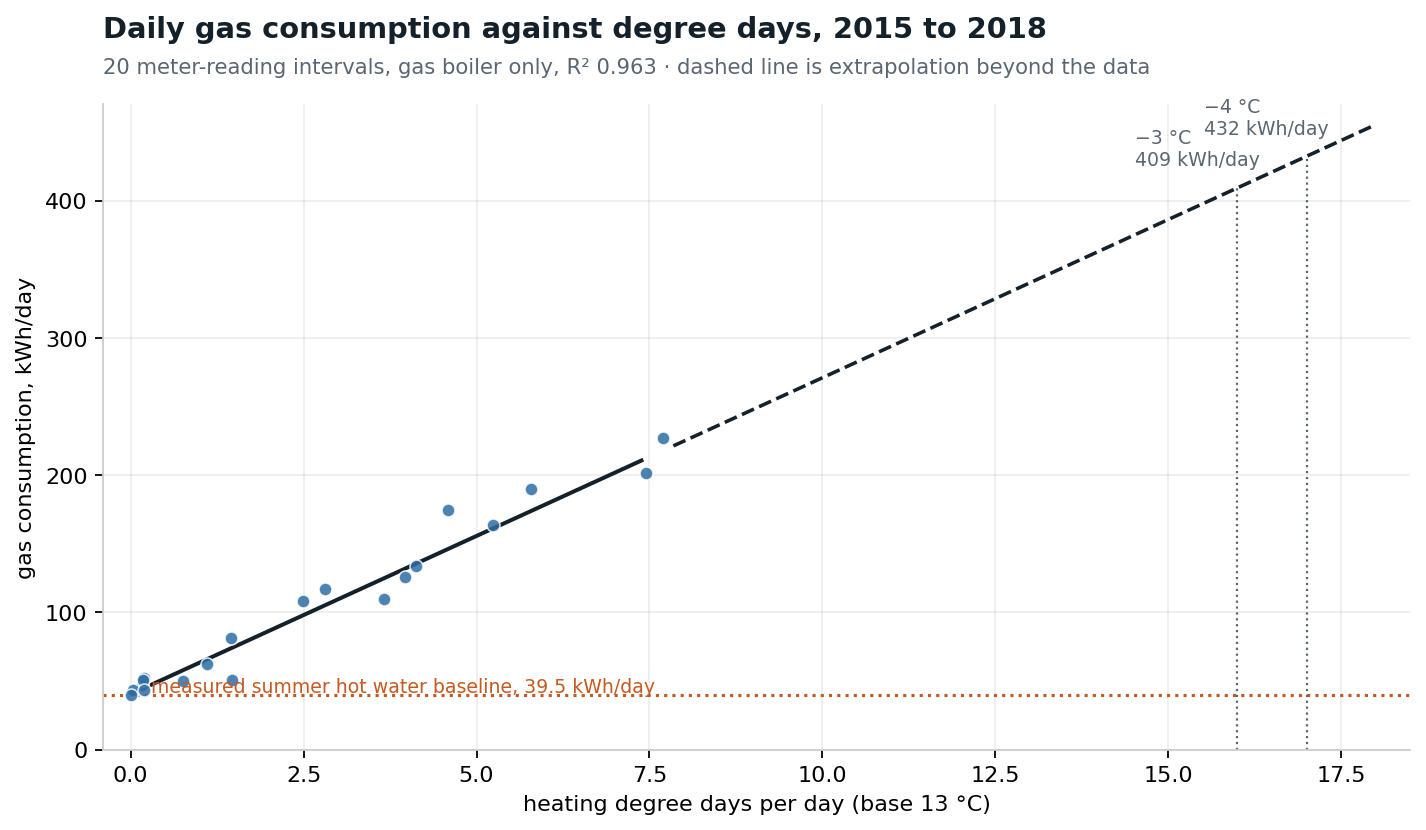
I've deblobbed the chart and extrapolated. Also gas usage for DHW was a crazily high 39 kWh per day mainly because the circulating pump was running from 07:00 to 22:00 during the period (see one of my earlier posts on this thread).
1
03/09/2026 7:50 pm
@jon — thanks for posting the revised chart, I hope you agree it looks cleaner, and so also less confusing, with same sized blobs.
It goes without saying that extent of extrapolation is enough to tighten the sphincters, but this is based on the premise that the energy delivered will be linear (if all the other conditions are met, notably the IAT) and so it is not an entirely unreasonable assumption. But it absolutely needs checking with real data (and @bobflux is right to mention the calibrated meter option) collected over a cold spell.
You've reminded me I think I recall that you did something to 'zero the baseline' at some point, to take out the DHW use. I'd be inclined to keep it simpler and more transparent, do the regression for all the energy delivered, and only remove the DHW by simple subtraction. Or separate them out at the data collection stage, which is what I do (diverter valve position), and I think you may also now do?
Midea 14kW (for now...) ASHP heating both building and DHW
1
03/09/2026 8:22 pm
@cathoderay if I could give two thumbs up for that post I would. However pressing the thumbs up a second time deletes the first. I concede that this is a sensible design decision by the software engineers.
4kW peak of solar PV since 2011; EV and a 1930s house which has been partially renovated to improve its efficiency. 7kW Vaillant heat pump.

Topic starter
03/09/2026 8:47 pm
@cathoderay Yes, it does look much better, thanks for suggesting it. I do now log gas consumption for DHW additionally to the total consumption, so it's now easy to separate out DHW from heating, but I wasn't able to do it in the 2015-18 period in the chart.
03/09/2026 8:57 pm
it's now easy to separate out DHW from heating,
Good but - with your recirculating pump a high proportion of our DHW consumption is actually heating the house! Best to bear that in mind!
4kW peak of solar PV since 2011; EV and a 1930s house which has been partially renovated to improve its efficiency. 7kW Vaillant heat pump.
04/09/2026 7:48 am
with your recirculating pump a high proportion of our DHW consumption is actually heating the house! Best to bear that in mind!
A very good point. In effect, the DHW pipework is an emitter, and very likely not a trivial one, given the figures @jon has previously posted. Maybe work backwards from an estimate of the amount of hot water you actually use, and calculate the energy needed to heat that using the formula @jamespa posted earlier, and then subtract that from the total energy delivered to the house. Or now that you have separate numbers for space heating and DHW heating, reallocate some of the latter to the former, again based on your actual hot water use.
Midea 14kW (for now...) ASHP heating both building and DHW

08/09/2026 11:02 am
I’m really liking reading through this thread and the robust logic being applied. My contribution is less analytical but may act as a sanity check. Your extrapolation to -3/-4 is indeed eye watering and perhaps you might consider plotting error bars on the data and slope?
Our worst heating day was5th
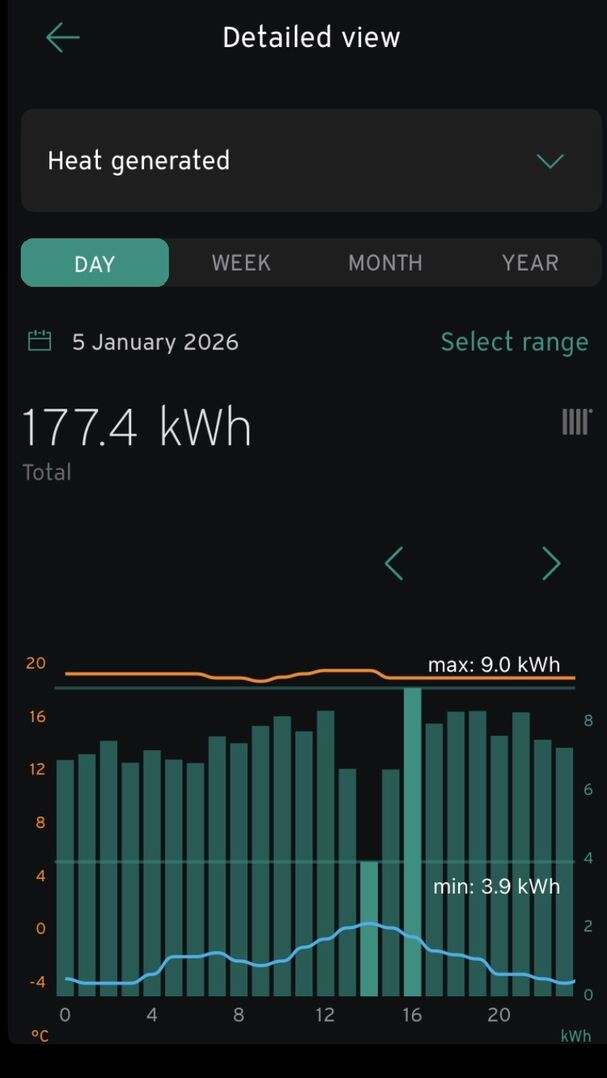
Jan this year in a 200m2 1950s reasonably insulated house set to 21C internal temperature. The outside temperature never got above zero and was -4C in the night.
The heat output is uncalibrated from the 7kW Vaillant and I estimate reading about 5% over, (many threads on need for calibration of temperature sensors exist).
Your house ought to be more thermally efficient from its build standard so you probably won’t need 2.5 times our usage to heat it (ratio of floor areas).
If you decide to go to the lower end of your estimate range supplemental heating from air to air heat pumps might be useful, in key rooms not least because you mentioned summer cooling in a virtually a throw-away line earlier.
i look forward to your room by room heat loss calculation and I found Heatpunk very useful https://heatpunk.co.uk
2kW + Growatt & 4kW +Sunnyboy PV on south-facing roof Solar thermal. 9.5kWh Givenergy battery with AC3. MVHR. Vaillant 7kW ASHP (very pleased with SCOP >4) open system operating on WC
1

SPONSORS

Degrees of Separation

Latest Posts
-

RE: Heat pump branding. Clever, contemporary… or a bit too much?
I think Heat Geek have done an amazing job on their bra...
By Tomtheheatingengineer , 7 hours ago
-
RE: HeatGeek vs Octopus surveys: puzzling disparity - any ideas why?
I have just had 3 heat loss surveys, one by heat geek o...
By David , 7 hours ago
-
RE: Heat Geek Zero Disrupt: Are We Sleepwalking Into Another Race to the Bottom?
I think that's the key question. After all inverter uni...
By Prunus , 9 hours ago
-
RE: battery storage without solar
As of October 1st they need specific qualifications to ...
By EtchedPixels , 10 hours ago
-
RE: How should the Boiler Upgrade Scheme be reformed?
A unit which uses water to transfer the heat/chill from...
By Temperature_Gradient , 10 hours ago
-
RE: Renewables & Heat Pumps in the News
With regards to the BUS grant raid, I gave it more thou...
By ASHP-BOBBA , 10 hours ago
-
RE: Why are ASHP installs so expensive?
The whole system seems to work on the basis of...
By ian33a , 11 hours ago
-
RE: Missing flow temperature in Heat Geek proposal
Good plan. If you can get half hourly meter readings a...
By JamesPa , 16 hours ago
-
RE: Heat Pumps Without Grants: Would You Have Installed One & Will You Now?
@editor Most certainly. The heat pump was an ideal s...
By Abernyte , 16 hours ago
-
Although regulations may well vary from country to coun...
By Majordennisbloodnok , 17 hours ago
-
RE: Does anyone have experience of a smart water meter?
Yep I caught our slow leak from a £100 bill rise 8)
By EtchedPixels , 17 hours ago
-
RE: Do You Need a Buffer Tank or Low Loss Header for Underfloor Heating in a Large Property?
@jamespa in some cases, failing the Turing test might b...
By GrahamF , 20 hours ago
-
RE: Passiv Smart Thermostat - Help & Forum Support
@energystoragetech The heat capacity of some...
By JamesPa , 22 hours ago
-
RE: tepeo ZEB UK Support & Info Thread
Sorry you are correct, I was remembering figures from t...
By JamesPa , 1 day ago




SPONSORS

