

Notifications
Clear all
Joining the Renewable Heating Hub forums is completely free and only takes a minute. By registering you’ll be able to ask questions, join discussions, follow topics you’re interested in, bookmark useful threads and receive notifications when someone replies. Non-registered members also do not have access to our AI features. When choosing your username, please note that it cannot be changed later, so we recommend avoiding brand or product names. Before registering, please take a moment to read the Forum Rules & Terms of Use so we can keep the community helpful, respectful and informative for everyone. Thanks for joining!
Air Source Heat Pumps (ASHPs)
65
Posts
5
Users
5
Reactions
2,513
Views
05/09/2026 7:41 pm
@ian33a — I'm not so sure about the numbers in the last spreadsheet excerpt you posted. If your average daily oil use is 6.58L, and if an average heating season is 150 days, then that gives a total of 987L pa, yet you say your annual use is 2402L. Over a full year that is 6.58l per day, but you are not (I take it) running the heating all year round! 2402L over 150 days is 16L per day.
There is a similar problem with the January 2026 use of 367L. Over 31 days, that works out at 11.8L per day, and this is a period in which (I think) you also had the heat pump running. However, if the 11.8L use per day is correct, then on average you were delivering 11.8 x 10.35 x 0.7 = 85.5 kWh per day / 3.56 kWh per hour to the house from the boiler. On a 50:50 split that means a total of 7.12 kWh per hour, but on a 20:80 boiler:heat pump split the heat loss then becomes 35.6 kWh per hour. Neither figure is credible, the first is too low, the second is way way too high.
I think without knowing the split for historical data you are on a hide into nothing here. Playing 'what if it was X:Y' games is really just playing with a random number generator.
I wonder, how do you know the oil use for Jan 2026 was 367L? I ask, because accuracy matters here. If you know it was 367L, and you also know how many kWh the heat pump used, and the COP, over the same period (to work out the energy delivered to the house by the heat pump), then you could make a stab at determining the relative split over January 2026. But you are still no closer to a heat loss at design conditions. If you have a mean OAT for your house for Jan 2024, then you might be able to say when the mean OAT is whatever it was, then the mean heat loss is whatever it was. But that is just a single data point. Some may say that is in fact enough, because in fact you do have another data point, the heat loss is zero at a mean OAT of 15.5°C (or thereabouts), and so you can draw a line with a gradient and see what the heat loss is at the design OAT.
It may be worth trying that on an out of interest basis, but I would still be very sceptical of any result. What you need is a range of kWh values (hourly or if not daily) over a range of matching hourly or daily mean OAT values that you can plot to (a) check the plot is credible and if it is then (b) see what the kWh delivered is at the design OAT. As always, the constant IAT requirement applies.
The underlying problem here is the loss of information inherent in using averages. It's a bit like knowing on average parents have 1.5 children. Apart from the fact there is no such thing as a 1.5 child (unless possibly you count some very weird congenital abnormalities), the average tells you nothing about how many children real world parents have. The range of possibilities that could give rise to an average of 1.5 is large, and you have no way of knowing which one reflects reality. In the same way an average for January 2026 loses the very range of KWh / OAT values that just might yield enough information to let you get closer to the real heat loss at design temperatures.
Midea 14kW (for now...) ASHP heating both building and DHW
05/09/2026 7:59 pm
I'm sure you could easily adapt it to oil usage, assuming that you have a reasonably accurate measure of oil use during that period.
It's an enticing idea, but the problem is knowing the oil usage over the reference period to sufficient accuracy. All I had was a sight gauge on the side of my tank, and yes, I could measure the height of the column, and do the calculations, but I suspect the measurement accuracy of a tape measure held against a column is a very long way from perfect. Over a day, probably not worth doing. Over a month? Perhaps. I no longer have an oil tank, and back when I did, I didn't know how useful it might be in the future to have monthly readings, so I didn't take them. But if someone reading this does have an oil tank and oil central heating, and has the interest, then it is certainly worth a try.
These days there may also be other devices (ultrasound based? float based?) that can measure oil use reasonably accurately. If such devices exist, and prove accurate, then we may be onto something.
Midea 14kW (for now...) ASHP heating both building and DHW

Topic starter
05/09/2026 8:32 pm
@cathoderay I started to record oil usage per month on a regular basis about two years ago. Before that it was somewhat haphazard in frequency but everything was accounted for on an irregular cadence.
I'm first to admit that the accuracy is suspect - it's always difficult with a large tank. However, by measuring the height of the oil with a dipstick on the first of every month, it gave me something. I also found that it was pretty accurate if done carefully. I could cross correlate a tanker delivery (which I assume was a properly calibrated amount) with what I measured, irrespective of the amount of oil in the tank before and afterwards and to within just a few litres.
I didn't bother with a more frequent cadence. Once a day was impossible, especially when the tank was half full. Every week, perhaps more helpful, but a chore and not done.
Obviously, I have no more granularity than monthly so cannot account for cold and warm days and how the oil usage will vary depending upon OAT. All I could do was establish a trend on a monthly cadence.
I do agree though, extrapolating to a shorter cadence if fraught with issues and my earlier experiments don't prove anything conclusive.
I had looked at other methods but none of them are accurate - an electronic gauge which comes with the tank has just ten graduations. I didn't want to spend a fortune on other methods so gave up!
This post was modified 1 month ago by ian33a
Escaped to the country : central Devon - 280 sqm converted mill - 4KW Solar - 15 KWh Battery - UFH - Vaillant Arotherm V2 Plus 12KW (soon!)

05/09/2026 10:47 pm
An approach, given that we are looking to understand how to size a heatpump (so the maximum power ever needed for a 3 or 6hr period), is perhaps to look at using that specific peak consumption period in a similar house similarly heated in a nearby area (but where gas is used, so with detailed consumption data) to estimate the peak consumption in the oil heated house.
Like if that highest consumption period is x and y is the total gas consumption for that month, we would assume the x to y ratio would be equal to the ratio of w (the best guess of oil consumption in the highest period of that month) to z (the total oil consumption for that month)..
Of course finding a gas heated home that matches may be too tricky…
This post was modified 1 month ago by Batpred
8kW Solis S6-EH1P8K-L-PLUS hybrid inverter; G99: 8kW export; 16kWh Seplos Fogstar battery; Ohme Home Pro EV charger; Vaillant Arotherm Pro 7kW; 100Amp head, HA lab on mini PC


05/09/2026 10:48 pm
I am amazed that there is not something out there to measure depth, either by float or laser. I can buy a laser distance meter for £30, it wouldn't take a lot to mount this in a cap so you could screw it in to the top of a tank. It sounds like there is a product to be developed.
4kW peak of solar PV since 2011; EV and a 1930s house which has been partially renovated to improve its efficiency. 7kW Vaillant heat pump.
Topic starter
06/09/2026 5:42 am
@batpred This is a great idea in theory. Our house is in three parts, a third constructed in the early 1700's, a third in mid Victorian times, and the final third constructed about 20 years ago. The internals have been heavily modified by the previous owner. I would love to find one just like it but I doubt I ever will !
@JamePA I thought along the same lines, but without breaking the bank. My Bosch laser measurer was utterly hopeless - the readings were totally random. I think the system in the tank is ultrasonic - but the readout is graduated in 10% increments , so no use.
Escaped to the country : central Devon - 280 sqm converted mill - 4KW Solar - 15 KWh Battery - UFH - Vaillant Arotherm V2 Plus 12KW (soon!)

06/09/2026 8:30 am
You only need the heat energy in kWh output by your heating system for 1 cold month e.g. January, along with your average indoor temperature and average outdoor temperature for that month to get a good estimate of heat loss. The changes in outdoor temperature are irrelevant provided that for the whole month, the indoor temperature remains higher than outdoors.
There is only one temperature at which there is no heat loss, and that is when indoor and outdoor temperatures match exactly. Even if the indoor temperature is only 1 degree above the outdoor temperature, then the house still loses heat. The reason that most people can turn off their heating when outdoor temperatures reach 15C or so is that the extra heat needed to keep the house at 20C is provided by other sources. These include background electricity use (fridges, freezers, TV, kettle, dish washer, washing machine etc.) all that electricity ends up as heat within the house with close to 100% efficiency. Then there are people in the house producing about 100W of heat each all the time that they are there, and solar gain through the windows which is low in January but not completely insignificant, and much higher in spring and autumn. This is why January is a great month to use for a heat loss estimate.
What you are trying to work out is the Heat Transfer Coefficient (HTC) which is the heat loss for every 1 degree difference between indoor and outdoor temperature. Overall heat loss is then proportional to the temperature difference, Delta:
Heat loss = HTC x Delta
How do you work out HTC based on data? This depends on the total energy E going into the house in the reference period, and the total degree-hours in that period.
HTC = E / degree-hours
degree-hours = SUM over all hours h of (IT_h - OT_h), where IT_h and OT_h are the indoor and outdoor temperatures for that hour.
SUM over all hours h of (IT_h - OT_h) = SUM over all hours h of (IT_h) - SUM over all hours h of (OT_h)
Now SUM over all hours h of (IT_h) / (31 x 24) is the average indoor temperature, AIT, for the month of January, similarly for the average outdoor temperature, AOT.
Hence we can substitute the average temperatures back into the equation for degree-hours:
degree-hours = (AIT - AOT) x 31 x 24
Hence:
HTC = E/(((AIT - AOT) x 31 x 24)
and
Heat loss = (E x Delta) /(((AIT - AOT) x 31 x 24)
Given you already have a measure of energy from oil usage for January at 110 kWh per day average - about 3420 kWh for the month. You could look up the average temperature for January 2026 from your local met office weather station, and make a reasonable estimate of your average indoor temperature throughout the house overthe whole month. Then you have enough information to proceed with the basic calculation. Better still, you can use the spreadsheet that I posted to also take account of extra energy coming from other sources.
For our house in January, these additional sources of heat amounted to about 480 kWh, with the gas heating providing a further 2470 kWh for 2950 kWh in total. Average indoor temperature was 18.2 and outdoors 2.8C. So the uplift was 15.4 degrees. That gave a HTC of 257W and a heat loss of 6.2kW.
1
06/09/2026 9:53 am
I suspect most if not all of the tank level measuring systems available will have been developed to tell the owner when they need to fill up their tank, for which no great accuracy is needed. Increments of 10% are more than enough. For a thousand litre tank, that is an effective resolution of to the nearest 100L. For our purposes, we need something closer to the nearest litre. For my 2 foot wide by 4 foot long tank, a litre of oil would raise the level by 1.35mm, less than 1/16th of an inch, 10L by 1.35cm and so on. Maybe there are in line flow meters that can do better, but no one fits them so far as I know, because in normal use there is no need for them.
When I first set up my heat pump monitoring system, I did check that the mean for an hour really was the same as each minute of that hour summed (sometimes I need to demonstrate to myself the maths works, logic alone is not enough). By the same token, a mean for a day will be the same as the sum of each hour in that day, and so on, but each time we increase the interval, we smooth out the extremes, and so lose the very information we want. The X axis on our chart (the mean OAT) gets shorter and shorter, until we finally end up with that one reading for the whole heating season centred somewhere in the middle.
Another consideration is reliability vs validity of measurement, where reliability is the repeatability (repeated measurements give the same value, which may or may not be valid) and validity is the accuracy (the measurements reflects the true value). Because we are measuring volume by relative levels, we only need a reliable measurement.
I am amazed that there is not something out there to measure depth, either by float or laser.
These things certainly exist, along with ultrasound and radar devices, but it is extremely difficult to find out how reliable and valid they are. Float gauges are usually very crude, we can forget them, especially when by a series of levers the actual gauge is shortened to a few inches. The other electronic devices often have accuracy quoted in the 1 - 3% range, but for a small 1000L tank that is in the 10 to 30L range, not good enough for our purposes. Even a device that is said to be '+/- 1% accurate' isn't good enough, because that is +/- 10L. Most of the google results for 'how accurate are heating oil tank gauges' are marketing pages for particular products. However, I did come across a utoob video (I normally avoid them like the plague!) in which some dude compared an ultrasonic meter with weight measurements for an LPG (propane) tank, and posted the results (at 14:47 minutes in):
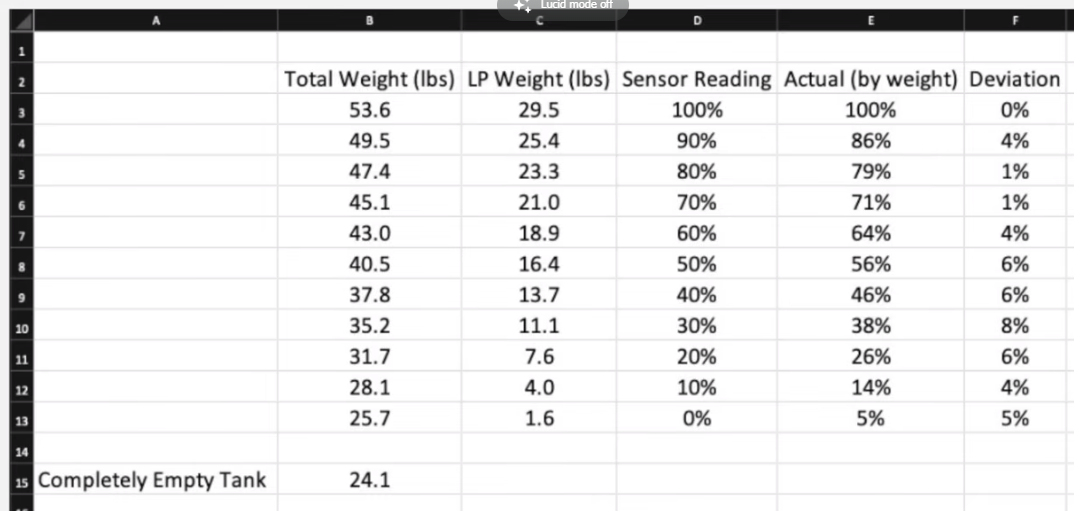
which suggests that for most of the range, the ultrasound measurement is neither reliable or valid enough for our purposes, assuming liquid propane and CH oil behave similarly under ultrasound monitoring.
There is another approach, which I think we discussed at some time in the past, using the length of time the oil burner runs for. The idea is the nozzle is calibrated to deliver oil at a certain rate, so that rate x time gives the volume. Thus a 0.65 gallons per hour (0.041 litres per minute) nozzle running for 30 minutes during one hour will have delivered 30 x 0.041 = 1.23L during that hour. Burner on/off could perhaps be sensed electrically by whether the burner's oil delivery pump is running or not. It may or may not be necessary to factor in the oil pump pressure (which should be in the spec) or not, need to check whether a 0.65 GPH nozzle always delivers 0.65 GPH, or whether it depends on pump pressure.
Putting all this together:
(1) I think we have to conclude that the best we can hope for with any tank measurement based approach is daily values, and even then they are going to be suspect (measuring 10L with an accuracy of +/- 10L isn't going to get us vary far). Hourly values are out of the question, and longer periods eg per week or month increasingly suffer from the loss of variability problem.
(2) the nozzle based approach does at least have appeal on paper. In effect, the nozzle (times time) becomes the meter. There are some suggestions that a simple engine hour meter (eg as used on boat engines, detects when the circuit is energised) connected across the burner pump circuit could do cumulative running hours, and it may not take much more to get the data logged automatically at hourly intervals. It seems someone hes managed to do this successfully, see for example here.
If I still had an oil boiler, I would definitely investigate the nozzle based approach to monitoring.
Midea 14kW (for now...) ASHP heating both building and DHW

06/09/2026 10:27 am
@rob-of-york — thanks again for posting in such such comprehensive and comprehensible detail, you are a great asset to the forum!
Given you already have a measure of energy from oil usage for January at 110 kWh per day average - about 3420 kWh for the month. You could look up the average temperature for January 2026 from your local met office weather station, and make a reasonable estimate of your average indoor temperature throughout the house overthe whole month. Then you have enough information to proceed with the basic calculation. Better still, you can use the spreadsheet that I posted to also take account of extra energy coming from other sources.
I think the problems here are
(a) there is some uncertainly about the actual daily kWh delivered to the house by the boiler, see previous posts, it may be better to use the Jan 2026 monthly use (367L), and derive the energy delivered from that
(b) I'm sure this was a dual heat source period (boiler and heat pump both in use), so the oil boiler energy supplied isn't the total energy supplied
(c) heat loss determination by energy delivered for heat pump sizing is best done net of other non-boiler heat sources, because the number you want is the amount of energy the heat pump needs to supply after the other sources of heat have given their contribution
(d) local met office weather stations vary considerably in the data they make available, and you may not have one that is that nearby. Gridded historical weather data appears comprehensive, but is as discussed previously of surprisingly low resolution. 'Intelligent guesswork' is certainly an option, but local on site measurements are better by far, and I am pretty sure @ian33a is already doing them, for both inside and outside air temperature. Since any sensor measurement is always a spot measurement, you need enough measurements to include the short term variations in the daily mean, ie hourly measurements.
Putting all this together, I think @ian33a has two options:
(1) use the Jan 2026 data, as long as there is sufficient IAT and OAT data, there is sufficient confidence in the 367L figure, and the heat pump contribution (if it was in use as I think it was) can be factored in
(2) get set up to do the measurements over the coming winter
The two options are of course not mutually exclusive.
Midea 14kW (for now...) ASHP heating both building and DHW
06/09/2026 10:28 am
Good bit of analysis. Daily would suffice for consumption (as you say more frequently is needed for temperature); my main tool was to plot daily consumption Vs daily degree days. Over a season this gives plenty of data with sensible averaging given the house time constant. If we can't measure a liguid level in a tank rigidly bolted to the ground to better than 0.1mm something is wrong. This is hardly a big ask in measurement technology. I guess there just isn't the demand to create a product so your nozzle approach may well be the best.
Anything more granular than daily can be useful as a check but really the demand at this level has too much noise* to be of primary value.
*It's not really noise, it's the effects of history and the on/offs of emitters. These differ from instance to instance of the same average temperature so manifest as variations in demand for any given value which we interpret as noise.
This post was modified 1 month ago 3 times by JamesPa
4kW peak of solar PV since 2011; EV and a 1930s house which has been partially renovated to improve its efficiency. 7kW Vaillant heat pump.
06/09/2026 12:10 pm
The way the calculation works is to determine the Heat Transfer Coefficient (HTC) - the total energy required to keep the indoor temperature 1C above outdoor, i.e. to balance the heat loss. HTC can then be used to work out the whole house heat loss for a worst-case day, e.g. -3C outside, 21C inside, gives Delta of 24 and heat loss = 24 x HTC. The HTC value is found by averaging over lots of degree-hours, however, the details of exactly what happens each hour or each day are unnecessary for the calculation (a big advantage in this approach), only the average indoor and outdoor temperatures for the month are needed along with the energy going in from various sources. (Caveat that outdoor temperature is always below indoor).
Using a longer reference period would give more data and improved accuracy, however, the problem then is solar gain. Solar gain becomes much larger in spring or autumn, as an indication, our solar PV system produced 160 kWh in Jan, compared to 940 kWh in April. January is a long enough period to get decent accuracy for the HTC value, without the variability of a potentially much larger solar gain becoming an issue.
The reason that I have included other sources of heat (electrical, people, solar) is that the total heat loss is derived from a balance between energy in and energy out. Now if the other sources provide say 500W, that can be subtracted from the heat loss figure when sizing a heat pump, since it doesn't have to produce that energy. The other sources do however need to be included in the calculation to get good accuracy in the HTC value and the total heat loss. (Imagine a weird January where it's 16C average outside and 18C average inside and no heating is needed to achieve that. The HTC isn't zero, rather the temperature uplift is due to 500W from other sources and the HTC is 250W. The heat loss is 6kW (for a Delta of 24) and a heat pump needs to produce 5.5kW to keep the house at 21C when it's -3C outside, since 500W come from elsewhere.
The gold standard for obtaining monthly average indoor and outdoor temperatures is to have your own weather station. I'm fortunate to have a semi-professional one in my back garden, with the indoor unit in the living room. Hence I have very good confidence in my average temperature figure. If @ian33a has the same then that's great, confidence in the results will be much greater. I agree that using "local" met office weather station data will lower accuracy.
Assuming good average temperature data, it comes down to figuring out the amount of energy going in from the heating system, and also other sources. The electrical energy is easily obtained from consumption data, less anything going to an EV, and the number of people hours of occupancy (at 0.1 kWh) can be readily estimated. Solar gain needs a little more thought; however, if you know area of the windows and which way they face, then 6/10/25 kWh per square m of North\East or West\South facing windows are reasonable estimates of incident energy for the whole of January. The total should be multiplied by the window area in square m and also by 0.5 to allow for only about 0.7 of the window area being glass and the double glazing only letting about 70% of the heat energy through (g-value of the glass).
06/09/2026 12:36 pm
I think this a very reasonable way to approach the problem. Whilst I dont like determining things based on a single measurement point because you don't have a tool to spot errors, I also recognise that you have to use the (best) info you can reasonably get. With oil (and gas without a smart meter) it would seem that monthly in January falls into that category so what you are suggesting seems sensible.
4kW peak of solar PV since 2011; EV and a 1930s house which has been partially renovated to improve its efficiency. 7kW Vaillant heat pump.

SPONSORS

Degrees of Separation

Latest Posts
-

RE: Heat pump branding. Clever, contemporary… or a bit too much?
I think Heat Geek have done an amazing job on their bra...
By Tomtheheatingengineer , 7 hours ago
-
RE: HeatGeek vs Octopus surveys: puzzling disparity - any ideas why?
I have just had 3 heat loss surveys, one by heat geek o...
By David , 7 hours ago
-
RE: Heat Geek Zero Disrupt: Are We Sleepwalking Into Another Race to the Bottom?
I think that's the key question. After all inverter uni...
By Prunus , 9 hours ago
-
RE: battery storage without solar
As of October 1st they need specific qualifications to ...
By EtchedPixels , 10 hours ago
-
RE: How should the Boiler Upgrade Scheme be reformed?
A unit which uses water to transfer the heat/chill from...
By Temperature_Gradient , 10 hours ago
-
RE: Renewables & Heat Pumps in the News
With regards to the BUS grant raid, I gave it more thou...
By ASHP-BOBBA , 10 hours ago
-
RE: Why are ASHP installs so expensive?
The whole system seems to work on the basis of...
By ian33a , 11 hours ago
-
RE: Missing flow temperature in Heat Geek proposal
Good plan. If you can get half hourly meter readings a...
By JamesPa , 16 hours ago
-
RE: Heat Pumps Without Grants: Would You Have Installed One & Will You Now?
@editor Most certainly. The heat pump was an ideal s...
By Abernyte , 16 hours ago
-
Although regulations may well vary from country to coun...
By Majordennisbloodnok , 17 hours ago
-
RE: Does anyone have experience of a smart water meter?
Yep I caught our slow leak from a £100 bill rise 8)
By EtchedPixels , 17 hours ago
-
RE: Do You Need a Buffer Tank or Low Loss Header for Underfloor Heating in a Large Property?
@jamespa in some cases, failing the Turing test might b...
By GrahamF , 20 hours ago
-
RE: Passiv Smart Thermostat - Help & Forum Support
@energystoragetech The heat capacity of some...
By JamesPa , 22 hours ago
-
RE: tepeo ZEB UK Support & Info Thread
Sorry you are correct, I was remembering figures from t...
By JamesPa , 1 day ago




SPONSORS
