

Notifications
Clear all
Joining the Renewable Heating Hub forums is completely free and only takes a minute. By registering you’ll be able to ask questions, join discussions, follow topics you’re interested in, bookmark useful threads and receive notifications when someone replies. Non-registered members also do not have access to our AI features. When choosing your username, please note that it cannot be changed later, so we recommend avoiding brand or product names. Before registering, please take a moment to read the Forum Rules & Terms of Use so we can keep the community helpful, respectful and informative for everyone. Thanks for joining!
Air Source Heat Pumps (ASHPs)
65
Posts
5
Users
5
Reactions
3,186
Views
07/09/2026 5:47 pm
Can you add up the energy used for DHW each day? If so then at least for the daily averages, you could get the total heat pump output across all hours and then subtract the DHW contribution.
I could but I would like to try to find a more generic solution, working on it now!
Midea 14kW (for now...) ASHP heating both building and DHW
07/09/2026 6:09 pm
OK, this one is fairly easy, because most of what is needed is in a 24 hour data file (logs past 24 hour values every hour on the hour):
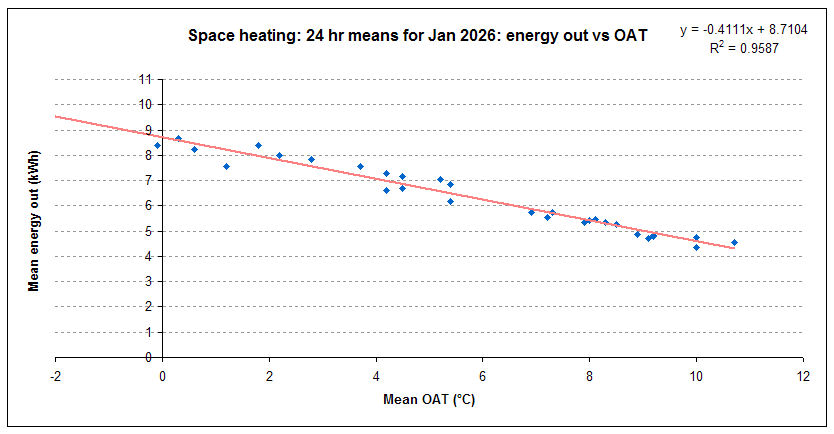
The sql used to get the data, variable names are ugly but just about human readable, T00: in the like clause gets the midnight value:
"select datetime,amb_24h_mean,round(htg_24h_kWh_out/24,2) from midea_24h_data.csv where datetime like '2026-01-__T00:%' order by datetime"
The htg_24h_kWh_out variable contains all the space heating for the 24h period, including the pesky hours that also has some DHW heating.
The IAT-OAT version will take a bit longer as the IAT is not in the 24h data file.
Using like '2026-__-__T00:%' will get all 2026 data, I can then plot individual months, 1st Jan to end of heating season, whatever.
Edit 1956h: I've just realised the above code gets data from 31st Dec 2025 to 30 Jan 2026 because 2026-01-01T00:00:00 contains the data for the day before ie 31st Dec 2025 and so on until 2026-01-31T00:00:00 contains the data for 30th Jan 2026. Probably doesn't really matter in the great scheme of things, but sloppy of me not to spot this at the time I did the query.
This post was modified 2 months ago by cathodeRay
Midea 14kW (for now...) ASHP heating both building and DHW

07/09/2026 9:47 pm
I think there is a reasonable argument to simply include the DHW heating in your values. The heat loss calculated will then be for the fabric of the house, plus the heat lost through hot water that drains away. Since the heat pump has to replace all of the heat for both CH and DHW, arguably that is a good measure to use for heat pump sizing. Otherwise, you end up working out the fabric heat loss and hence the output needed for CH, and then later adding enough to cover DHW on top of that.
I have gas consumption values on a daily basis, with no way of separating DHW from CH, so I'm going to try this myself.
08/09/2026 8:32 am
@rob-of-york — I have total energy delivered plus separate space and DHW heating values so can do the analysis either way. However, since we call the result the heat loss and by convention that is for the building I can see the benefit in sticking with convention. My main problem at the moment is file clutter and poorly documented analyses, the bane of ad hoc progress, and I am trying to tidy things up. There is also a small discrepancy in the energy out results depending on how I retrieve and consolidate the data (I have available python, which does the initial retrieval and some basic calculations and puts the data in the csv files, and which I can also use for further analysis, plus spreadsheets (pivot tables etc, but they can't handle very large files) plus sql which can actually do some of the calculations as it selects the data, and finally R which has a steep learning curve, but is very capable once you have got your head round it, and it, along with python, has the best charting output. The great advantage of keeping the data in csv files rather than a more conventional database is that just about anything (including even us humans) can read the data in its raw format.
There are also other minor hiccups that I needs to sort out eg missing data because of power cuts, of which I have had more than a few over the last year or so as one of my lighting circuits has been playing up, at first very intermittently, and then more regularly, almost certainly over-active rodents, and it has both tripped the RCD, and needed the power off while it gets fixed.
with no way of separating DHW from CH
I, and I am pretty sure others, use the position of the three port two way diverter valve, which is often in the data, and can be logged, and then use simple IF statements to allocate the variables to space or DHW heating. It does mean you need to have some way of communicating with your system though, eg a modbus connection.
Midea 14kW (for now...) ASHP heating both building and DHW

08/09/2026 2:23 pm
I've managed to get some nice results myself based on data from Oct-24 to Mar-25. I will shortly put them in the thread below, since they sit very well alongside the other methods of heat loss calculation.
@cathoderay I think the problem we identified with the y-axis intercept on your graph may well be down to not enough data. When I tried doing this with just one month's data, i.e. 31 data points, it was not at all satisfactory; however with 6 months data, and 182 data points, it worked very well. I'll post something on that too in the other thread.
Many thanks to you both for the discussions on this and helping me get to what appears to be a good practical method, given enough data.
Page 6 / 6
Prev

SPONSORS

Degrees of Separation
Latest Posts
-

RE: New Build 3 Phase or 1Phase
Main issue with 3 phase at low power (16A per phase) is...
By bobflux , 1 minute ago
-
RE: How will removing the standing charge on gas bills benefit heat pumps?
I'm not sure it makes much of a difference to heat-pump...
By Temperature_Gradient , 9 hours ago
-
@editor Ouch, sorry to re start the tick. I had assume...
By DavidB , 10 hours ago
-
RE: Say hello and introduce yourself
@e-a-west as the good Major said, welcome to the forums...
By Mars , 11 hours ago
-
RE: How much of your renewable and home setup would still work if the internet went down?
Yes I actually have a copy of a tool that whenever a ce...
By EtchedPixels , 21 hours ago
-
RE: Indevolt Batteries UK Support & Info Thread
@editor Hi, To resolve this, please tap on the A...
By Indevolt Tech , 1 day ago
-
RE: Double or Triple Glazed Windows?
Posted by: @singlespeed With 9 years repairing windo...
By Rob of York , 2 days ago
-
@transparent we’re still running a secure version of PH...
By Mars , 2 days ago
-
RE: How quickly would you want/expect heat recovery to take from setback?
Much longer than that here. The heating isn't even on. ...
By bobflux , 3 days ago
-
RE: Passiv Smart Thermostat - Help & Forum Support
Obviously the weather is changeable but there's a defin...
By Singlespeed , 3 days ago
-
RE: The Changing Jet Stream Could Challenge UK Air Source Heat Pumps
@rob-of-york I must admit that when we had a Daikin hea...
By Toodles , 3 days ago
-
RE: Forum updates, announcements & issues
Get the Renewable Heating Hub heads-up on WhatsApp. I...
By Mars , 3 days ago
-
RE: Safety study for plug in batteries out to tender - looks like Q3 2027 at best before legal
@editor I pointed out to the one of the Fuse execs that...
By dansus , 3 days ago
-
RE: 15kw pump for 225m2 1990's house - over kill?
@seaviews As well as loft insulation, there are othe...
By Rob of York , 3 days ago




SPONSORS
