

Notifications
Clear all
Joining the Renewable Heating Hub forums is completely free and only takes a minute. By registering you’ll be able to ask questions, join discussions, follow topics you’re interested in, bookmark useful threads and receive notifications when someone replies. Non-registered members also do not have access to our AI features. When choosing your username, please note that it cannot be changed later, so we recommend avoiding brand or product names. Before registering, please take a moment to read the Forum Rules & Terms of Use so we can keep the community helpful, respectful and informative for everyone. Thanks for joining!
Air Source Heat Pumps (ASHPs)
65
Posts
5
Users
5
Reactions
3,185
Views

07/09/2026 11:14 am
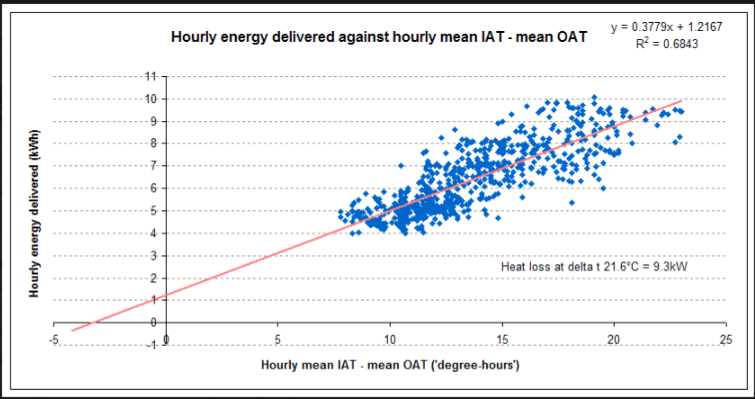
@cathoderay I have a suspicion that the minimum output of your heat pump may be a factor in the surprising result shown in your latest graph, regarding the y-axis intercept. Looking at the graph, there is a floor at 4kW below which there are no points, and the random scatter of points doesn't look quite the same between 9C and 12C and 4kW and 5kW, its denser there. That's a tell tail that something different is going on in that region.
I asked Google for "Midea 14kW heat pump minimum output" and the AI response was "The nominal 14kW Midea M-Thermal air-to-water heat pump typically has a minimum modulated heating output of roughly 3.5 kW to 4.5 kW depending on ambient and water flow temperatures".
It will be interesting to see what a graph of the daily averaged data gives.
To clarify, for the daily average power, just add all the hourly averages together and divide the total by 24. (The y-axis of these graphs is really just power output as it is energy delivered in an hour per hour, or energy delivered in a day per day).
If your heat pump stops running for a while because it hits it's minimum output, how does that appear in your raw data? (I would have expected to see some values below 4kW for hours where lower output is required, and the heat pump ran for some number of minutes at 4kW and spent the rest of the time off).
1

07/09/2026 11:22 am
The outdoor temperature can change much faster than the indoor temperature. This is because the air outside has very little thermal inertia (heat capacity) compared to the house. This is easily observed on summer days when the heating is off. The swings in outdoor temperature between day and night can be very large, often 15 degrees or more, whereas a well-insulated house will only change in temperature by a few degrees. Further, there is a lag between the two cycles as the house take time to warm up and to cool down. Thermal inertia can be described in terms of a time constant, which technically is defined as the time for the temperature of an object move about 63% of the way towards thermal equilibrium with its environment, when that environment undergoes an instant change in temperature. This time constant can be quite long, e.g. a few days for a well-insulated house, more for one of stone construction.
This matters because it tells us something about the intervals of time that it would be appropriate to average over to get each data point for a graph.
Absolutely agree.
When I did my heat loss determination I averaged over a day and found that the fit was better, albeit only marginally, if the consumption was delayed by 12 hrs relative to the OAT (I plotted against OAT because I didn't have IAT but knew it was fairly constant).
This post was modified 2 months ago 2 times by JamesPa
4kW peak of solar PV since 2011; EV and a 1930s house which has been partially renovated to improve its efficiency. 7kW Vaillant heat pump.
07/09/2026 11:35 am
You appear to have a fixed loss (ie when DT=0 you still have to supply the house with energy to keep it at a constant temperature)
I agree, the plots suggest this, but it can't be what happens on the ground, or can it? My OAT plots show data points in the high OAT range (when present eg the Oct to mid-Dec 2025 one) where the heat pump should not be delivering any energy. I need to go back and look at the raw data, perhaps even wait until I put the heating back on, and see what is actually happening.
If your heat pump stops running for a while because it hits it's minimum output, how does that appear in your raw data? (I would have expected to see some values below 4kW for hours where lower output is required, and the heat pump ran for some number of minutes at 4kW and spent the rest of the time off).
The minimum output is probably around 4kW (from the Engineering Data manual). One of the things about Midea heat pumps is they do a lot of cycling. You can just about see it, in very compressed form, in the LWT/RWT, on the right hand side of the January 2026 Heating Parameters chart I posted earlier. It is slow frequency cycling, so we tend to just live with it.
I will as I say go back and have a look at the raw data to see if there are any clues there as to what is going on, and will also do the daily plots.
Midea 14kW (for now...) ASHP heating both building and DHW
07/09/2026 11:38 am
You appear to have a fixed loss (ie when DT=0 you still have to supply the house with energy to keep it at a constant temperature)
I agree, the plots suggest this, but it can't be what happens on the ground, or can it?
No it cant, but it could be a (material) fixed or quasi-fixed consumption by the heat pump, or a variable loss elsewhere in the pipework (eg the PHE) that appears as quasi-fixed over the relatively small range of the plot. As @rob-of-york says it could be linked to your min output. It could also either be real or an artefact of the measurement technique. Points closer to the origin would help distinguish between these cases and IMHO its worth investigating.
This post was modified 2 months ago 2 times by JamesPa
4kW peak of solar PV since 2011; EV and a 1930s house which has been partially renovated to improve its efficiency. 7kW Vaillant heat pump.

07/09/2026 12:09 pm
I think there may be some clues here that point to the weather compensation curve being at least in part responsible for what we see happening. This is early Oct 2025, when the OAT was high enough at times to mean no energy need to be added, but it was. The upper chart is minute by minute data, the lower one hour by hour:
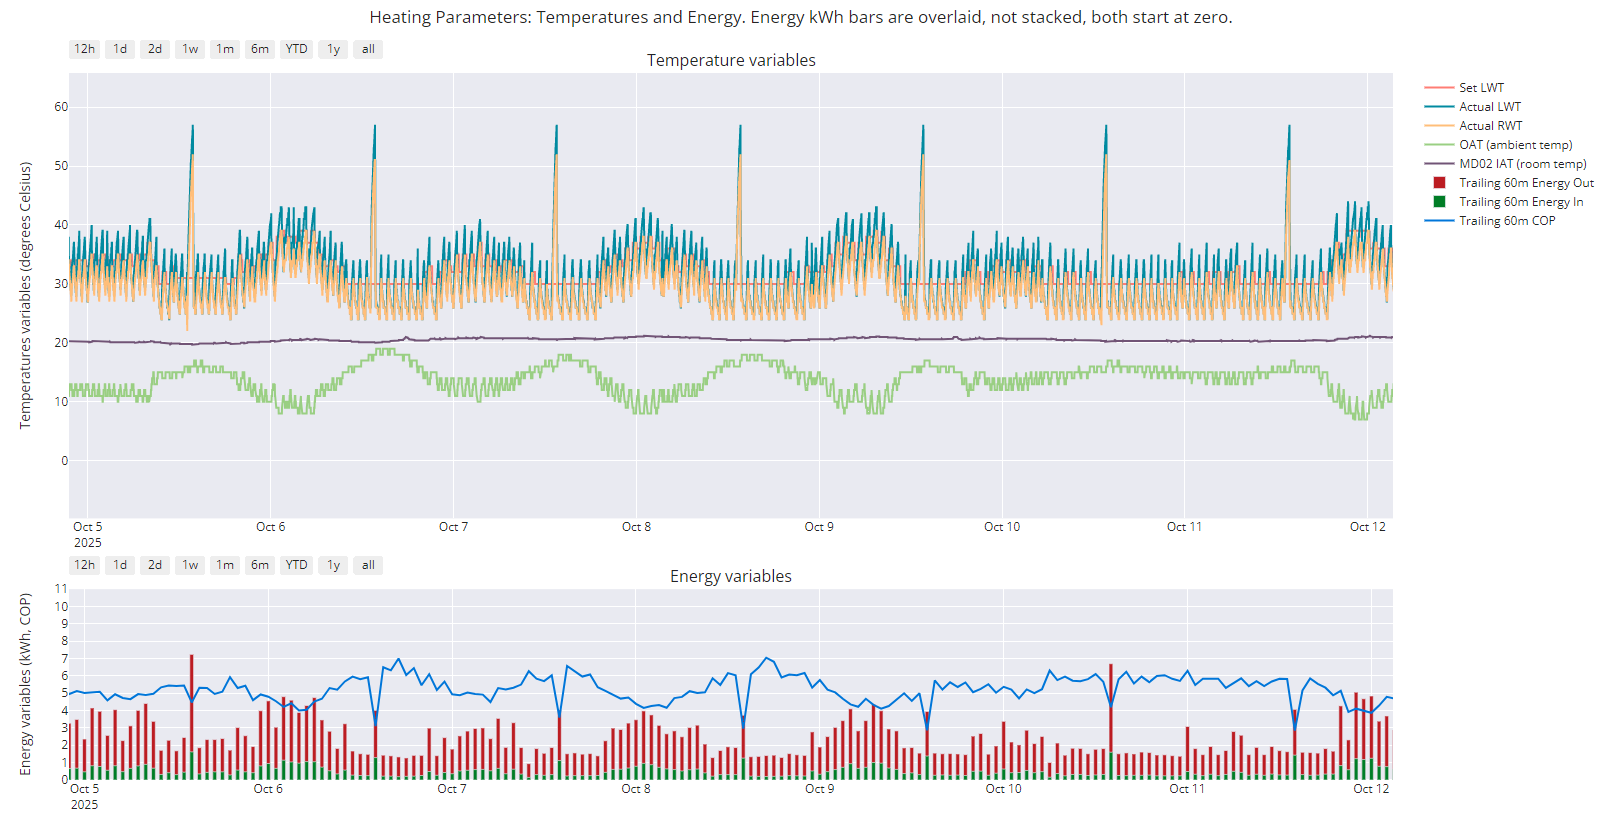
The OAT reached 18-19°C on the afternoon but the heat pump kept on running. I think it does this because it is on, and that is what the weather compensation curve tells it to do: when the OAT is 15° or more, set the LWT (can just be seen in the upper chart as the red line) to 30°C. The only way to stop it putting out heat at higher OATs is to turn it off!
Note the peaks and troughs of the LWT straddle the set LWT, ie the mean LWT is reasonably close to the set LWT.
This is the Midea weather compensation curve from the Freedom Installation manual:
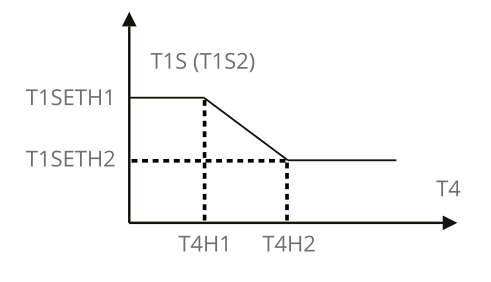
Any OAT at or above T4H2 will give rise to a LWT at T1SETH2. If the OAT goes into the 20s, the heat pump will still pump out water at 30°C.
Midea 14kW (for now...) ASHP heating both building and DHW
07/09/2026 12:50 pm
I think there may be some clues here that point to the weather compensation curve being at least in part responsible for what we see happening. This is early Oct 2025, when the OAT was high enough at times to mean no energy need to be added, but it was. The upper chart is minute by minute data, the lower one hour by hour:
Any OAT at or above T4H2 will give rise to a LWT at T1SETH2. If the OAT goes into the 20s, the heat pump will still pump out water at 30°C.
Could be, but of course that will cause the IAT to rise. There again you might, quite possibly do, open the door/windows to compensate. I set my min FT to 27 BTW and there is a good argument for setting it even lower.
If not convinced however, and probably wont be without some data closer to the origin and possibly also the associated IAT data. Is it possible to get that or does your averaging mean that this is not available.
Given the extent of the extrapolation it wouldn't take much to skew this graph up or down down so that the apparent intercept changes from its true value and if your IAT rises slightly as OAT rises (over the range of the data displayed) due to a slightly misadjusted WC curve (or underheating at low OAT) then that would account for the positive offset in the graph. This is where the fact that its actually DT that matters not OAT starts to matter!
This post was modified 2 months ago 2 times by JamesPa
4kW peak of solar PV since 2011; EV and a 1930s house which has been partially renovated to improve its efficiency. 7kW Vaillant heat pump.
07/09/2026 12:58 pm
If not convinced however, and probably wont be without some data closer to the origin.
It's not there because it is January data (was clear in original posting of the plot, but should have added that to the title). I'm currently looking at milder months when there is data closer to the origin, and I can see what happens when the OAT goes above the IAT (if I can find a period when that happened when the heat pump was on).
Midea 14kW (for now...) ASHP heating both building and DHW
07/09/2026 1:39 pm
I haven't been able to find a period when the heating was on, and the OAT was definitely above the IAT, but I have found a six hour period when the OAT was close to the IAT, and it clearly shows the heat pump was still both using and delivering energy. Both are separate calculations, so they sort of confirm each other, that the heat pump was working (running) when it didn't need to, and dong so, I presume, because that is what the weather compensation curve said it should do. The big spike in the middle is DHW heating.
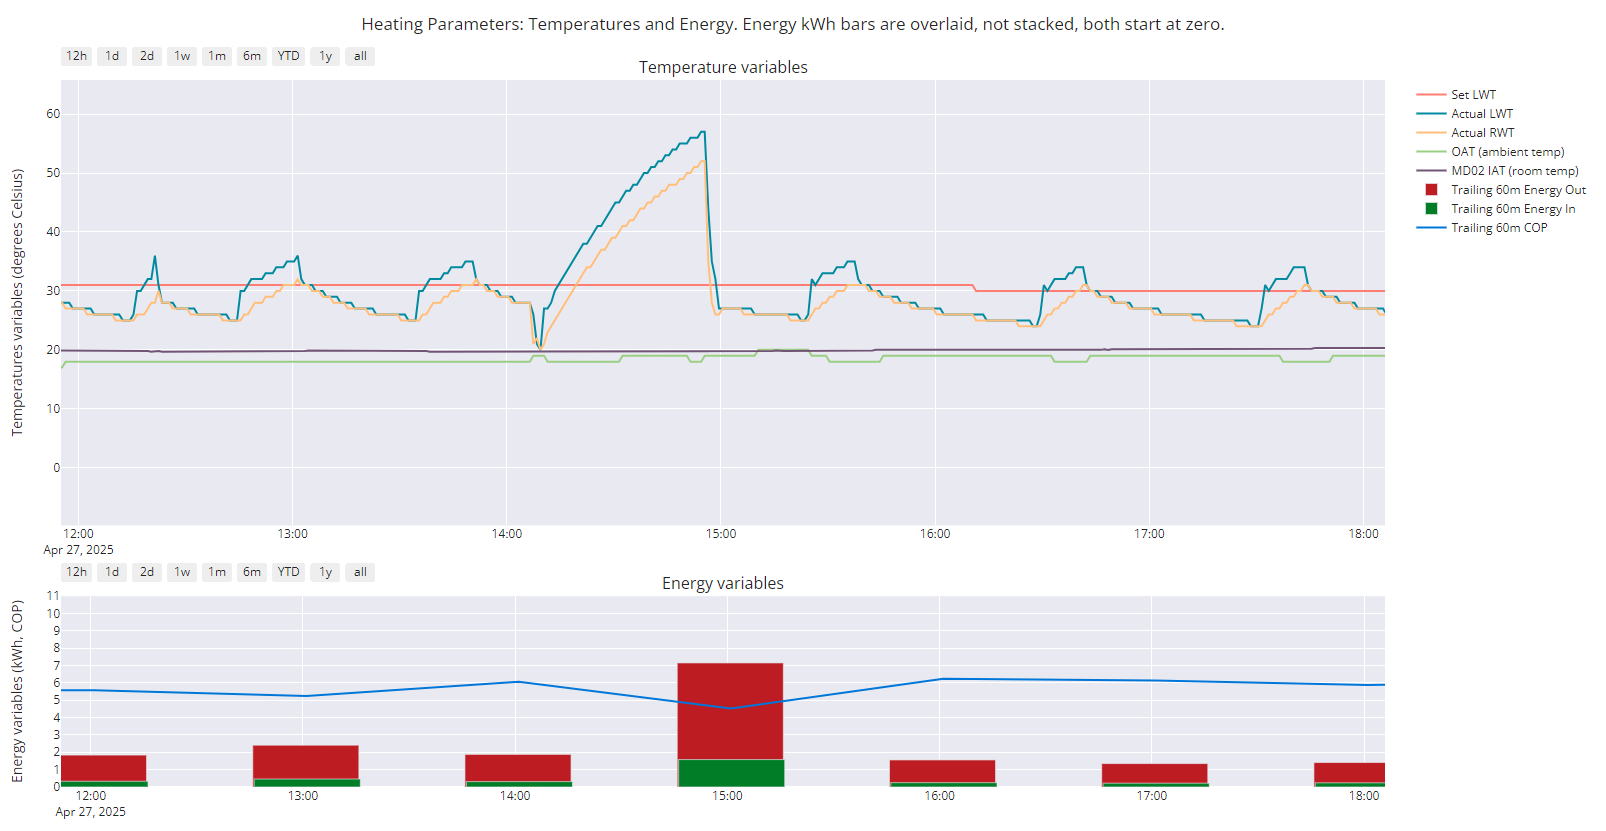
Presumably this is going to mess up the heat loss assessment, the data says the house needs heat when it doesn't.
Because of the shape of the Midea weather compensation curve, specifically the flat line after the T4H2 set point, I think it is well nigh impossible to get it to turn off completely at higher OATs without messing up the rest of the curve.
Midea 14kW (for now...) ASHP heating both building and DHW

07/09/2026 2:03 pm
Because of the shape of the Midea weather compensation curve, specifically the flat line after the T4H2 set point, I think it is well nigh impossible to get it to turn off completely at higher OATs without messing up the rest of the curve.
There may be a 'max temp for heating' parameter. Alternatively you could extrapolate the curve to a higher OAT point and set the T4H2 parameters accordingly. Not much heat will be emitted once the rad temp falls below 25-27.
4kW peak of solar PV since 2011; EV and a 1930s house which has been partially renovated to improve its efficiency. 7kW Vaillant heat pump.
07/09/2026 2:03 pm
If the heat pump occasionally over produces some extra heat and the indoor temperature rises accordingly, then that will be captured in the temperature differences, so should not affect the validity of the analysis. Unless of course the occupants of the house reacted to the higher indoor temperatures by opening lots of windows!
One thing that puzzles me though is that your graph against OAT for Oct to mid-Dec appears to show lots of points where the heat output is below 4 kW. It seems odd to me that there are points on that graph between 8C and 11C OAT that have outputs of less than 4kW, but none on the January graph for between 11 and 8 degrees (IAT - OAT), which is the same temperature range, assuming a 19C set point. Perhaps it is worth looking at the Oct to mid-Dec data in (IAT - OAT) form? Are there any differences between your data processing for these two cases?
I have a similar issue with the weather compensation curve for my gas boiler. On its current setting, it flat lines at 30C at 15C outside temperature. However, the boiler is also controlled by a programmable timer thermostat that turns it off overnight and if the room temperature gets too high, so I don't get the overheating problem or at least not by much. Similarly, when there is a lot of solar gain in the west facing rooms on spring and autumn evenings, then the TRVs will switch those radiators off at a degree or two above the set point for the main thermostat in the living room.
It is possible that your heat pump would benefit from having a simple thermostat control set a degree or two above the target temperature for the weather compensation. Then when you get lots of solar gain on a sunny but otherwise cold day, the house won't end up too hot - if that is an issue at all. (I'm assuming that the control of your heat pump is completely open loop, i.e. outdoor sensor and weather comp only, with no reference to indoor temperature?)
07/09/2026 3:04 pm
One thing that puzzles me though is that your graph against OAT for Oct to mid-Dec appears to show lots of points where the heat output is below 4 kW. It seems odd to me that there are points on that graph between 8C and 11C OAT that have outputs of less than 4kW, but none on the January graph for between 11 and 8 degrees (IAT - OAT), which is the same temperature range, assuming a 19C set point. Perhaps it is worth looking at the Oct to mid-Dec data in (IAT - OAT) form? Are there any differences between your data processing for these two cases?
One bit of data processing that I do may be relevant. The space and DHW energy values are separated out (by way of the position of the diverter valve, which is available over modbus) but because the DHW usually only take 30-45 mins, and then the system returns to space heating, most DHW hours also have a small amount of space heating. Since the values do not represent a full hours heating, I usually deal with these hours rather crudely by removing the offending rows, again rather crudely, by sorting by energy out and deleting the rows that appear to be affected. Looking at the chart data, it looks like I forgot (I did the chart a while ago) to remove the space heating rows affected by DHW heating. The Jan 2026 plot definitely has the affected rows removed.
I need to devise a way of removing these rows better. Removing any rows where there is any DHW energy use might be the answer, for which I think I can use 'q text as data', very useful CLI program that lets you run sql queries on csv files. A 'where htg_kWh_in = 0' clause or something similar should work.
It is possible that your heat pump would benefit from having a simple thermostat control set a degree or two above the target temperature for the weather compensation. Then when you get lots of solar gain on a sunny but otherwise cold day, the house won't end up too hot - if that is an issue at all. (I'm assuming that the control of your heat pump is completely open loop, i.e. outdoor sensor and weather comp only, with no reference to indoor temperature?)
Very possibly; however. The standard Midea setup is to use the room stat as a basic by season on/off switch, with it set very high eg 26°C during the heating season, and I could dial that down, but there may be a better way, doing it over modbus (which has write as well as read access to the Midea wired controller): just turn the whole thing off when the OAT is say > 15.5°C.
The system is 'open loop', but with the addition of a plate heat exchanger, a Freedom heat Pump warranty requirement at the time of installation. No buffers or low loss headers or any of that nonsense, all TRV valve heads off, lock shields all fully open (so as not to restrict flow, there is bit of history behind this) and yes outdoor sensor which is actually an air intake sensor because it is located next to the air intake of the heat pump, and so is affected by local air temperature changes caused by the heat pump, which can be seen as steps in the OAT, and a standard WCC setup. I do however use the IAT, by way of a python 'auto-adapt' script that bumps up the WCC up or down (by resetting the end points) depending on whether the IAT is too high or too low. This was primarily put in place to give a boost after a setback, and it behaves largely as expected.
Midea 14kW (for now...) ASHP heating both building and DHW
07/09/2026 3:30 pm
Can you add up the energy used for DHW each day? If so then at least for the daily averages, you could get the total heat pump output across all hours and then subtract the DHW contribution.

SPONSORS

Degrees of Separation
Latest Posts
-

RE: New Build 3 Phase or 1Phase
Main issue with 3 phase at low power (16A per phase) is...
By bobflux , 1 minute ago
-
RE: How will removing the standing charge on gas bills benefit heat pumps?
I'm not sure it makes much of a difference to heat-pump...
By Temperature_Gradient , 9 hours ago
-
@editor Ouch, sorry to re start the tick. I had assume...
By DavidB , 10 hours ago
-
RE: Say hello and introduce yourself
@e-a-west as the good Major said, welcome to the forums...
By Mars , 11 hours ago
-
RE: How much of your renewable and home setup would still work if the internet went down?
Yes I actually have a copy of a tool that whenever a ce...
By EtchedPixels , 21 hours ago
-
RE: Indevolt Batteries UK Support & Info Thread
@editor Hi, To resolve this, please tap on the A...
By Indevolt Tech , 1 day ago
-
RE: Double or Triple Glazed Windows?
Posted by: @singlespeed With 9 years repairing windo...
By Rob of York , 2 days ago
-
@transparent we’re still running a secure version of PH...
By Mars , 2 days ago
-
RE: How quickly would you want/expect heat recovery to take from setback?
Much longer than that here. The heating isn't even on. ...
By bobflux , 3 days ago
-
RE: Passiv Smart Thermostat - Help & Forum Support
Obviously the weather is changeable but there's a defin...
By Singlespeed , 3 days ago
-
RE: The Changing Jet Stream Could Challenge UK Air Source Heat Pumps
@rob-of-york I must admit that when we had a Daikin hea...
By Toodles , 3 days ago
-
RE: Forum updates, announcements & issues
Get the Renewable Heating Hub heads-up on WhatsApp. I...
By Mars , 3 days ago
-
RE: Safety study for plug in batteries out to tender - looks like Q3 2027 at best before legal
@editor I pointed out to the one of the Fuse execs that...
By dansus , 3 days ago
-
RE: 15kw pump for 225m2 1990's house - over kill?
@seaviews As well as loft insulation, there are othe...
By Rob of York , 3 days ago




SPONSORS

