

Notifications
Clear all
Joining the Renewable Heating Hub forums is completely free and only takes a minute. By registering you’ll be able to ask questions, join discussions, follow topics you’re interested in, bookmark useful threads and receive notifications when someone replies. Non-registered members also do not have access to our AI features. When choosing your username, please note that it cannot be changed later, so we recommend avoiding brand or product names. Before registering, please take a moment to read the Forum Rules & Terms of Use so we can keep the community helpful, respectful and informative for everyone. Thanks for joining!
Air Source Heat Pumps (ASHPs)
65
Posts
8
Users
6
Reactions
13.9 K
Views

22/12/2025 9:54 pm
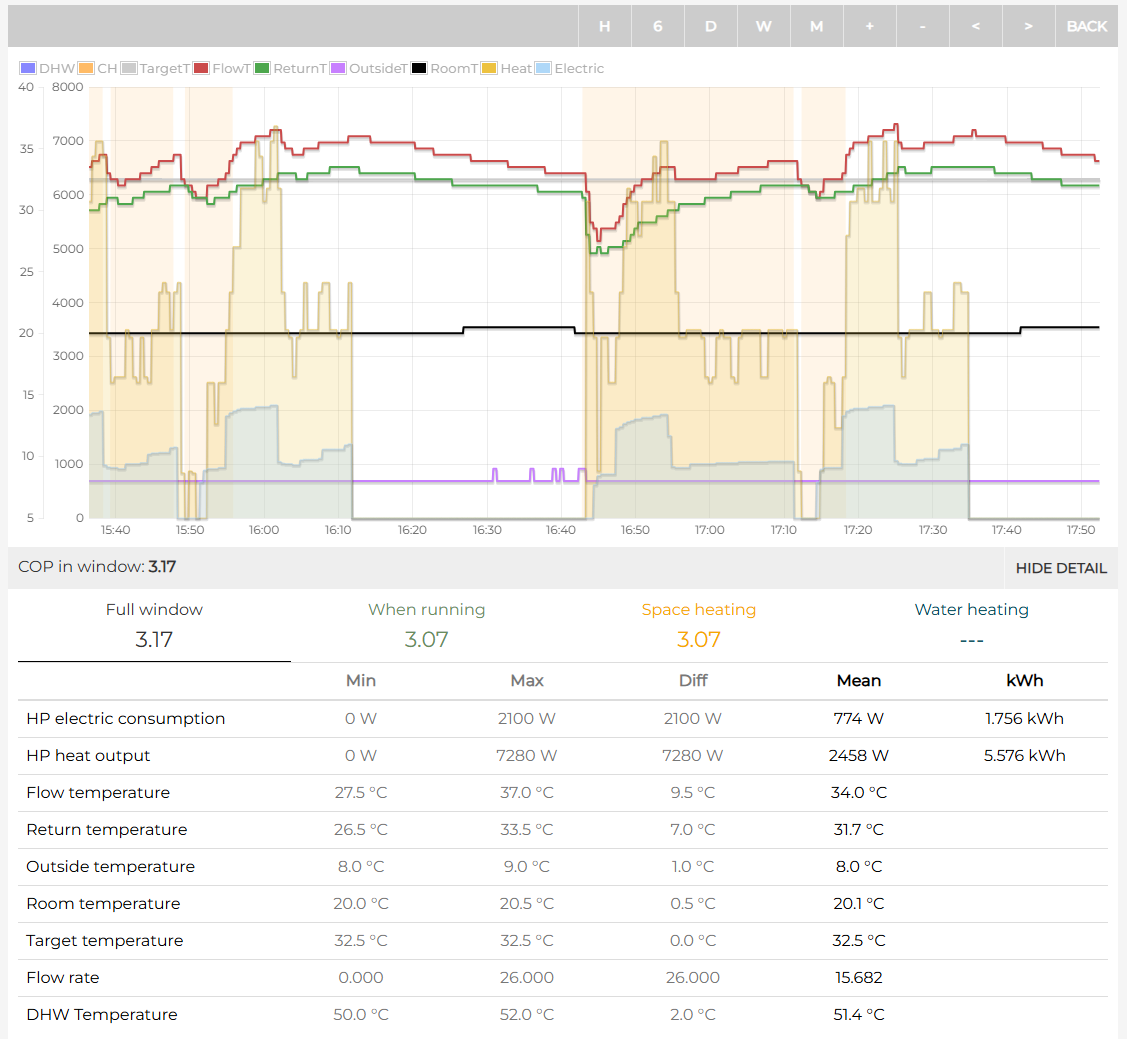
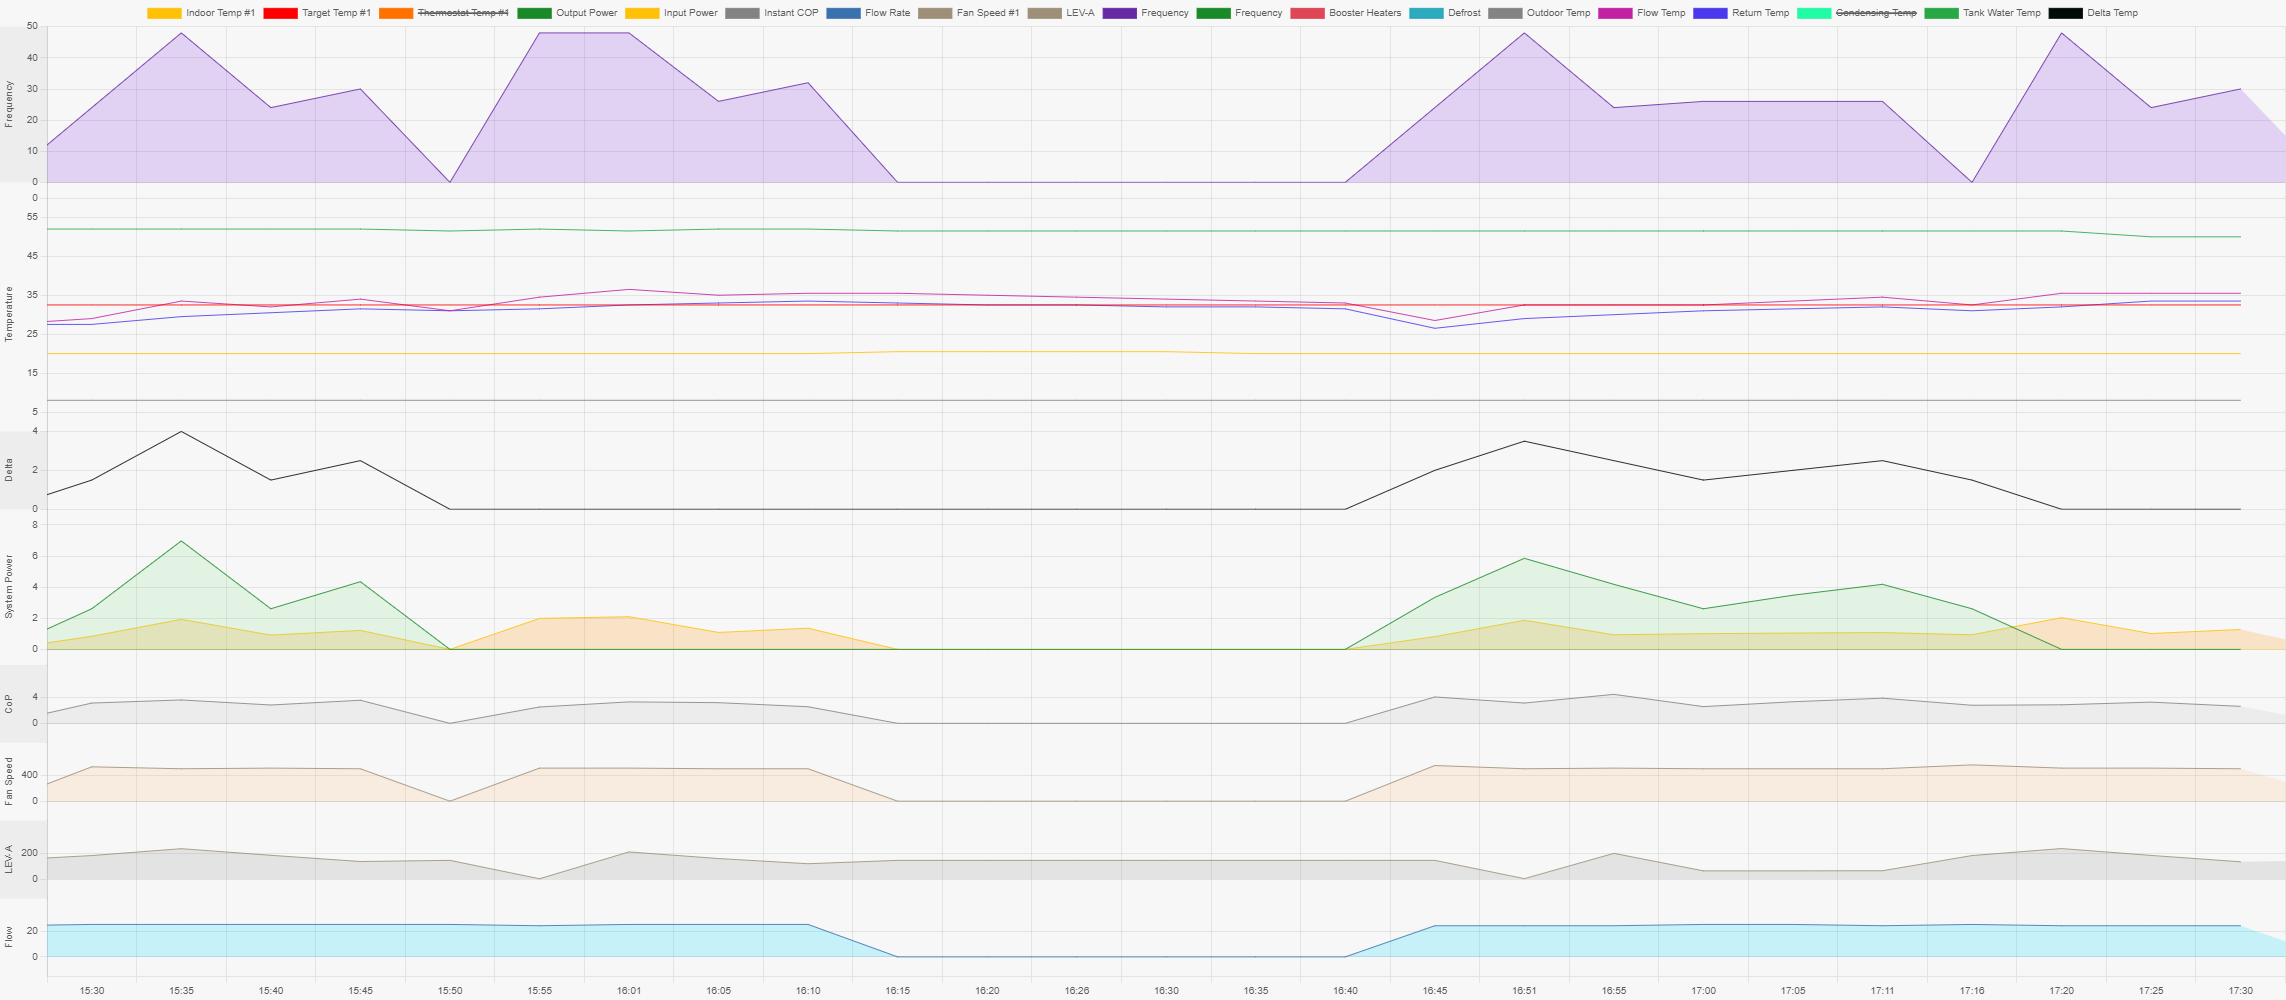
@ecoste For what it's worth, this is my equivalent data for the same time period which had the same external temperature (8°C) as yours was reporting. The outputs are via Mel Pump and the Open Energy Monitor configuration I've set up within Home Assistant. My system was cycling at intervals of around 1hr 20minutes at the time, so the output isn't as stable as yours, but there are various snapshots of data in the output that might be of use as a comparative. I've currently got the tolerance set to +3/-7 on the flow temperature target, rather than the standard +5/-5, which is a change I made at the weekend based on some older Ecodan-related posts I'd read on the forum.
I'd be happy to provide comparative data while you're investigating your own system, if it's of use to you, albeit it's from a system with an overall heating COP of 3.01 to date, so potentially not one that you're looking to emulate. I'll caveat that with the fact that it's saving me around 55% on my energy bills relative to using gas last year, so doing a satisfactory job from a bigger picture.
130m2 4 bed detached house in West Yorkshire
10kW Mitsubishi Ecodan R290 Heat Pump - Installed June 2025
6.3kWp PV, 5kW Sunsynk Inverter, 3 x 5.3kWh Sunsynk Batteries
MyEnergi Zappi Charger for 1 EV (Ioniq5) and 1 PHEV (Outlander)
User of Havenwise (Full control Jun-Dec 2025, DHW only from early Dec)
Subscriber to MelPump App data via CN105 Dongle Kit

23/12/2025 10:08 am
How would you check what the pump thinks the power consumption is?
Sorry I dont know the answer to that as I dont have a Mitsubishi myself. Perhaps @sheriff-fatman knows. I imagine somewhere in the installer section it would appear, or in some kind of 'live monitor' or 'current readings' or some sort, maybe in a 'service' section of the installer menu?. Its almost bound to be there somewhere, heat pumps measure everything!
Thanks for the data. In some ways its too steady, some noise/variation would help us understand whether the limited resolution of the readout was a factor or not. Im sure mother nature will oblige over the next few days. I think the key here is to keep collecting it to see what that tells us. Some really cold weather would be good as, when its cold, factors other than the actual compressor consumption' become less significant and fixed sensor errors ditto.
4kW peak of solar PV since 2011; EV and a 1930s house which has been partially renovated to improve its efficiency. 7kW Vaillant heat pump.
23/12/2025 11:28 am
Sorry I dont know the answer to that as I dont have a Mitsubishi myself. Perhaps @sheriff-fatman knows. I imagine somewhere in the installer section it would appear, or in some kind of 'live monitor' or 'current readings' or some sort, maybe in a 'service' section of the installer menu?. Its almost bound to be there somewhere, heat pumps measure everything!
I have the CN105 'dongle' connected to my system, which I'd recommend as an inexpensive purchase if you want to get as much info as the heat pump will provide to you. I can see the outputs from this in real time via the Home Assistant feed, so can provide a bit of insight into this.
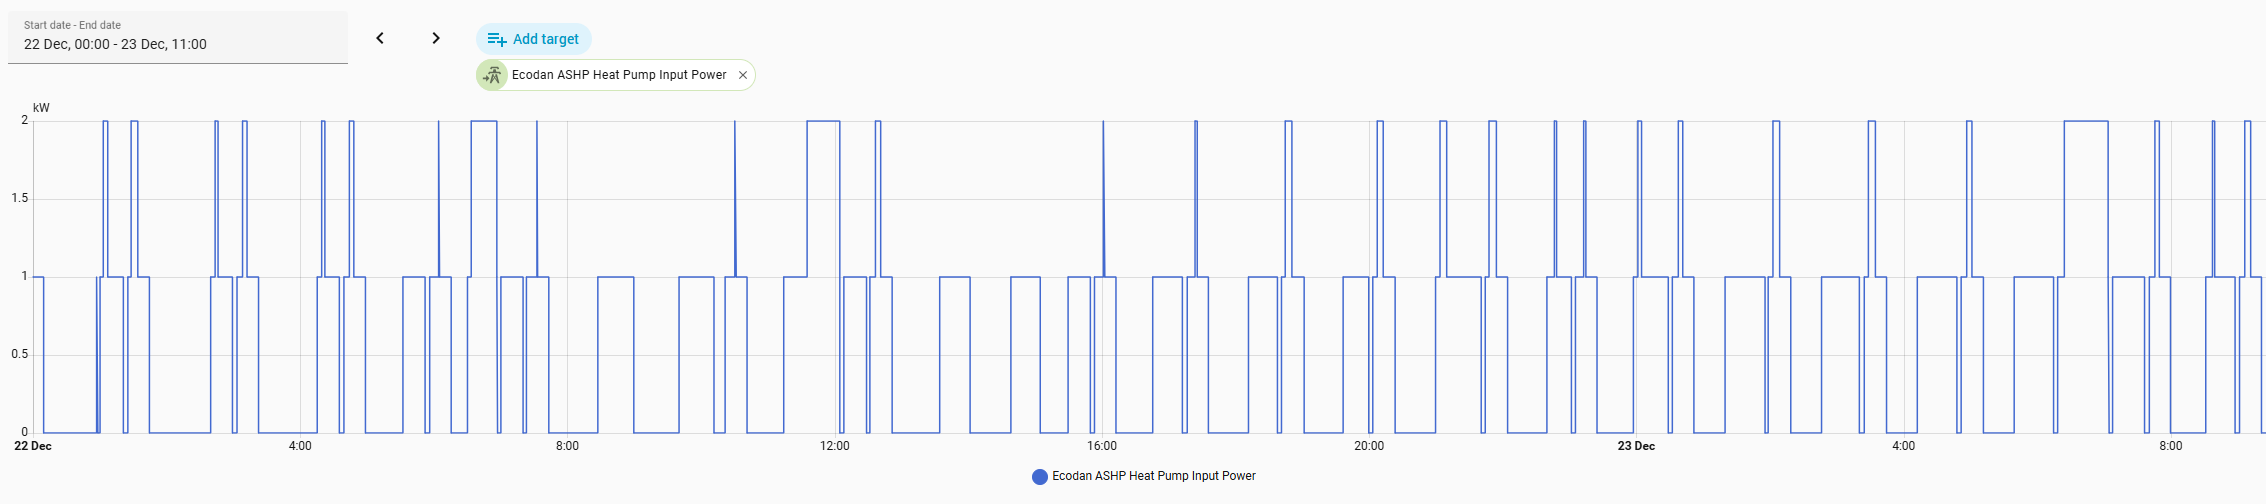
Within the list of data that it spits out there are two items listed as Heat Pump Input Power and Heat Pump Output Power, which immediately gives the impression that you're getting exactly the info you want. However, both only seem to report in full kWh, as the graph of recent input power shows.
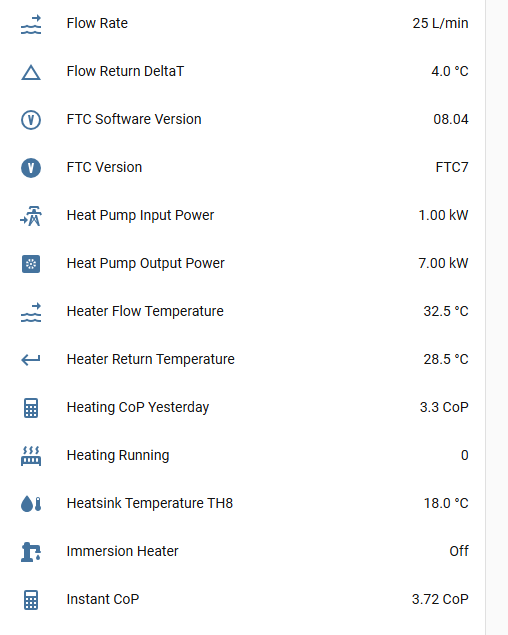
Separately, there are also various figures shown as 'computed' inputs and outputs. I assume the source of this is also directly from the heat pump, rather than anything built into the dongle to create these calculations, but this data is more in line with what you'd expect to see, as there is more variation within the figures shown at 2 decimal places. There are additional, separate outputs showing the figures split by whether they're being used for Heating, DHW or Cooling. Logically, these must simply feed from whichever of the binary settings for each function is set to 1 at that time. In the image below, the input power is going to DHW.
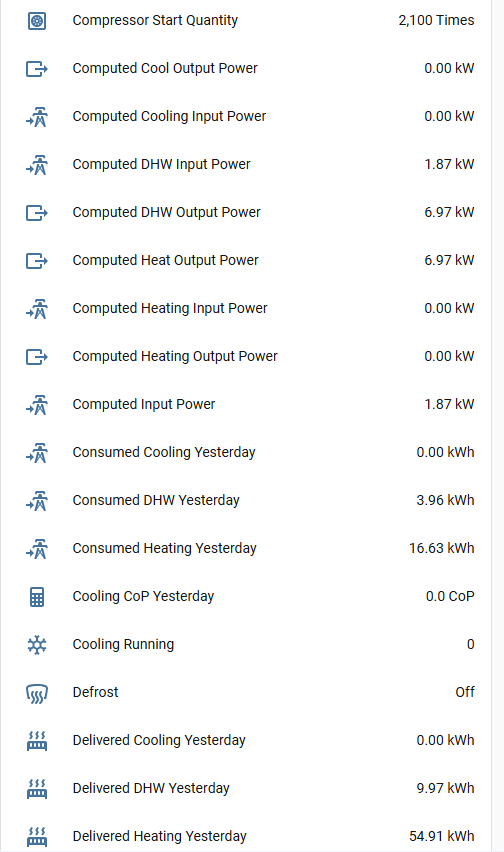
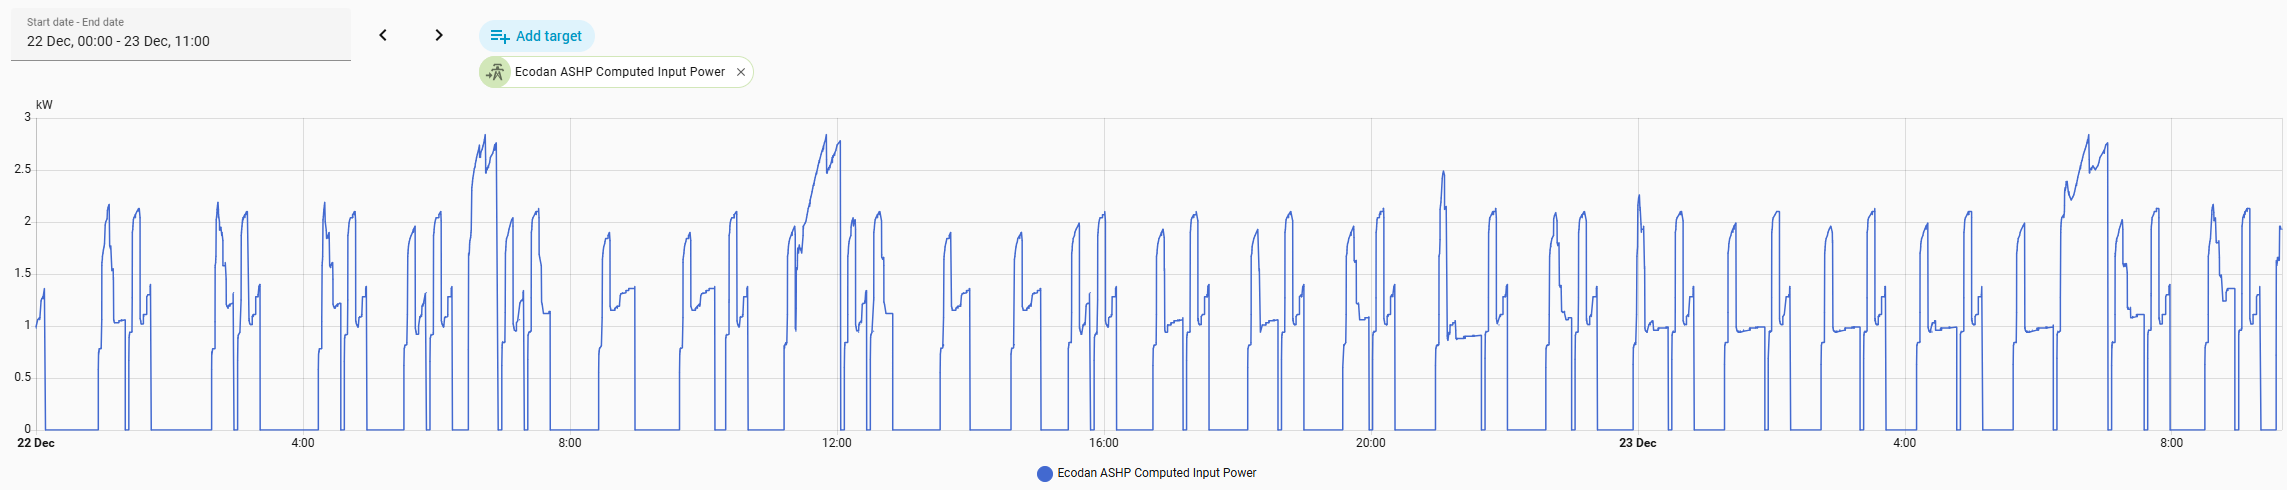
These are some of the raw sources of data I used to create the integration into the Open Energy Monitor data reporting. Doing so was the 'lightbulb' moment for me that the output figures aren't measured, but are simply based on the same theoretical calculations using flow rate, deltaT, etc that you're using in your manual calculations, and the output data is therefore only as good as the quality of the input data going into them. Short of adding one of the expensive flow monitoring kits from Open Energy Monitor the above numbers are the best available option, and there's far more within it than you can see using the reporting within MelCloud or from the controller, but it still feels like the input figures are being estimated in the reporting.
The other obvious limitations are that flow rate is reported as a whole number and the delta T always reports with 0.5°C granularity, which will introduce rounding errors into the calculations, but nothing to the extent that the figures would become unreliable. It will just introduce an additional margin of error into the reporting.
Beyond that, I have an electricity meter fitted near the water cylinder as part of the installation, which I assume is a standard thing, but could be wrong. I can use the readings to sense check the totals against the cumulative system reporting, or to measure the movement between two time points, e.g. to sense check a daily output. It would be helpful if I could interrogate the meter directly, but I have no ability to do so currently. I don't know if the heat pump itself is using this data directly. Logic suggests it should be, as otherwise why is the meter there at all, so perhaps this is the source of the whole number input power figures referred to above, as this would be a logical explanation why the increments are in whole numbers. If so, then it would confirm that the input usage reporting is based on reality, as it is being fed directly from meter data.
This post was modified 10 months ago by Sheriff Fatman
130m2 4 bed detached house in West Yorkshire
10kW Mitsubishi Ecodan R290 Heat Pump - Installed June 2025
6.3kWp PV, 5kW Sunsynk Inverter, 3 x 5.3kWh Sunsynk Batteries
MyEnergi Zappi Charger for 1 EV (Ioniq5) and 1 PHEV (Outlander)
User of Havenwise (Full control Jun-Dec 2025, DHW only from early Dec)
Subscriber to MelPump App data via CN105 Dongle Kit

Topic starter
23/12/2025 2:37 pm
@sheriff-fatman Thank you, food for thought. I think that I am about to be distracted by Christmas. Happy Christmas

23/12/2025 2:50 pm
@sheriff-fatman Thank you, food for thought. I think that I am about to be distracted by Christmas. Happy Christmas
And to you too. Wishing you a very enjoyable festive season not worrying about COPs, and where the only flow rates of relevance are potentially the alcoholic ones!
130m2 4 bed detached house in West Yorkshire
10kW Mitsubishi Ecodan R290 Heat Pump - Installed June 2025
6.3kWp PV, 5kW Sunsynk Inverter, 3 x 5.3kWh Sunsynk Batteries
MyEnergi Zappi Charger for 1 EV (Ioniq5) and 1 PHEV (Outlander)
User of Havenwise (Full control Jun-Dec 2025, DHW only from early Dec)
Subscriber to MelPump App data via CN105 Dongle Kit
1
Page 6 / 6
Prev

SPONSORS

Degrees of Separation

Latest Posts
-

RE: Heat pump branding. Clever, contemporary… or a bit too much?
I think Heat Geek have done an amazing job on their bra...
By Tomtheheatingengineer , 9 hours ago
-
RE: HeatGeek vs Octopus surveys: puzzling disparity - any ideas why?
I have just had 3 heat loss surveys, one by heat geek o...
By David , 9 hours ago
-
RE: Heat Geek Zero Disrupt: Are We Sleepwalking Into Another Race to the Bottom?
I think that's the key question. After all inverter uni...
By Prunus , 10 hours ago
-
RE: battery storage without solar
As of October 1st they need specific qualifications to ...
By EtchedPixels , 11 hours ago
-
RE: How should the Boiler Upgrade Scheme be reformed?
A unit which uses water to transfer the heat/chill from...
By Temperature_Gradient , 12 hours ago
-
RE: Renewables & Heat Pumps in the News
With regards to the BUS grant raid, I gave it more thou...
By ASHP-BOBBA , 12 hours ago
-
RE: Why are ASHP installs so expensive?
The whole system seems to work on the basis of...
By ian33a , 12 hours ago
-
RE: Missing flow temperature in Heat Geek proposal
Good plan. If you can get half hourly meter readings a...
By JamesPa , 17 hours ago
-
RE: Heat Pumps Without Grants: Would You Have Installed One & Will You Now?
@editor Most certainly. The heat pump was an ideal s...
By Abernyte , 18 hours ago
-
Although regulations may well vary from country to coun...
By Majordennisbloodnok , 18 hours ago
-
RE: Does anyone have experience of a smart water meter?
Yep I caught our slow leak from a £100 bill rise 8)
By EtchedPixels , 18 hours ago
-
RE: Do You Need a Buffer Tank or Low Loss Header for Underfloor Heating in a Large Property?
@jamespa in some cases, failing the Turing test might b...
By GrahamF , 21 hours ago
-
RE: Passiv Smart Thermostat - Help & Forum Support
@energystoragetech The heat capacity of some...
By JamesPa , 23 hours ago
-
RE: tepeo ZEB UK Support & Info Thread
Sorry you are correct, I was remembering figures from t...
By JamesPa , 1 day ago




SPONSORS
