

Notifications
Clear all
Joining the Renewable Heating Hub forums is completely free and only takes a minute. By registering you’ll be able to ask questions, join discussions, follow topics you’re interested in, bookmark useful threads and receive notifications when someone replies. Non-registered members also do not have access to our AI features. When choosing your username, please note that it cannot be changed later, so we recommend avoiding brand or product names. Before registering, please take a moment to read the Forum Rules & Terms of Use so we can keep the community helpful, respectful and informative for everyone. Thanks for joining!
09/09/2026 1:10 pm
The multiplication correctly calculates the loss, but the energy that the heat pump must supply is that minus the heat supplied by other sources. This comment would apply whether the HTC (ie the gradient of the power vs temperature line) is calculated from degree days or DT.
I'm still not sure! Consider this chart with an added line which represent to total heat loss:
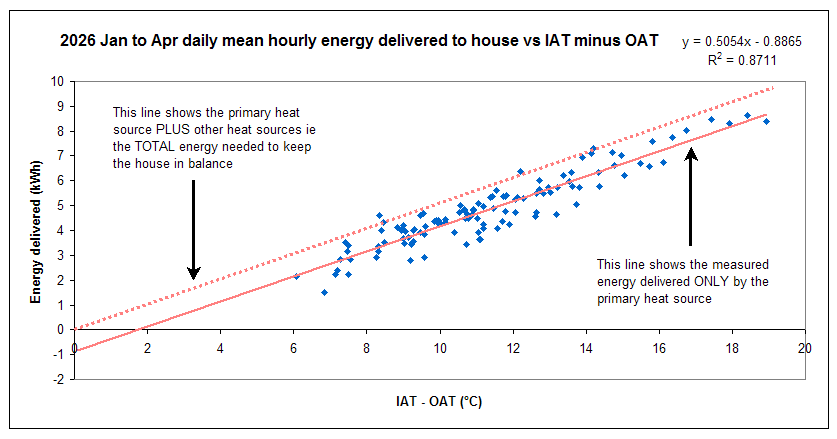
My reasoning: the added upper dotted line Y intercept is the 'everything in balance' point: OAT = IAT so IAT - OAT = 0, no energy is needed to keep something in balance that is already in balance. But the real point of interest is where the solid line crosses the X axis: this is the point at which the primary heat source no longer has to supply any heat, because the other heat sources provide enough. How much extra heat that other heat provides is shown by the vertical distance between the two lines, which as it happens is conveniently measured by the Y axis intercept, even if a that point we have the non-real imaginary concept of a heat source that puts out negative energy. So to get the total heat loss (represented by the added upper dotted line) you have to add the other heat sources energy to the heat pump energy, to get the total needed to keep the house in balance.
Or am I just being very thick?
Midea 14kW (for now...) ASHP heating both building and DHW
09/09/2026 1:51 pm
I'm pleased to see that your cleaned up data gives consistent results. It's great to see this analysis working in practice.
Plotting power against temperature difference is always going to be more accurate than using degree days, since the later is really just an approximation of the former that assumes the indoor temperature is fixed. Any variability in indoor temperature therefore leads to some additional inaccuracy in the heat loss estimation that isn't present when using temperature differences.
I agree, and I think it is good stuff to be posting, as it provides others who have sufficient data to do their own analyses.
The fact that your heat pump starts to struggle, i.e. doesn't quite put out enough heat when the outside temperature goes below the design value of -2C is further evidence that this heat loss estimate is about right.
It's possible it is struggling because at sub zero OATs the WCC is slightly under what it should be. It is where it is because it works well for most OATs, but at those lower OATs it gets into some serious defrosting and presumably that compromises output (though not by very much as you might imagine, I seem to recall from previous discussions in other threads). My current WCC left hand end set point is 52 @ -4, an attempt to deal with sub design temp OATs, ie those below -2°C, I could set that to something higher, say 54 @ -4, but I have previously been cautious because given the right conditions, too low an IAT, my auto-adapt script can push the set LWT even higher. Or maybe tweak the auto-adapt script. At the moment it is one degree for one degree, up to a max of three, ie IAT greater than one degree (to 1.99) too low pushes the WCC up one degree. This is in fact not sensitive to pick up the minor IAT drop to 18 degrees that occurred on the morning of the 6th Jan. In any event, I have a few degrees of unused top end set LWT I should be able to use, and that might push the output above 10 kW. I will what I can do when the weather gets cold.
It's interesting that we are talking a few hundreds of Watts differences here, when many theoretical heat loss estimates differ by a few kilo-Watts.
Indeed. The quotes I had had total heat losses ranging from 7 kW to 16 kW, including one that got all the rooms mixed up, with smaller rooms with fewer outside walls having higher heat losses than larger rooms with more outside walls. Even a basic sense check would have confirmed that couldn't be right. To add insult to injury, that was the grant administrator's 'preferred installer'. It wasn't my preferred installer In the event, the grant administrator saw my point (and there were other problems too), and we went with my preferred installer.
The tank already had hard foam insulation, but was still losing quite a lot of heat. The minor downside is that the airing cupboard is now much cooler and clothes need to stay in there for longer to completely dry.
I'm not too worried about the DHW tank losses, the tank is like yours in an airing cupboard, but the airing cupboard is in the middle of the first floor, so any tanks losses will mostly end up inside the house, all the more because the rather mobile warped door has a habit of opening by itself!
Lastly, I wonder if you have any comments on the discussion @jamespa and I are having about whether we add or subtract the other heat sources contributions when using the IAT - OAT based heat loss assessments?
Midea 14kW (for now...) ASHP heating both building and DHW

Topic starter
09/09/2026 1:57 pm
Unfortunately, there was a slip up in my working in some of the earlier posts.
When plotting measured power output vs. temperature difference, recall that the equation is:
PM = HTC(IT - OT) - PO.
where PM is the power output from the heating source obtained via measurements and PO is the (assumed constant) power output from other sources. On the graphs of power vs. temperature difference, PO is the negative of the y-axis intercept and HTC is the slope.
Assuming a design temperature difference of DT, then here's my slip up.
Heat loss = HTC x DT. (There is no subtraction of PO in this equation, which I had wrongly included)
Power required for space heating = (HTC x DT) - PO, since the other sources of heat provide some of the power needed.
Since I am unable to separate out gas usage for hot water from that for heating, I also made a correction for that. On average, about 150 units of gas are used for hot water in a 31 day month, corresponding to about 180W continuously. I assumed that heat energy disappears down the drain with the hot water, and subtracted it from both of the above computations, as it is not part of the fabric heat loss, and neither is it power required for space heating. To size a heat pump for both heating and hot water, the 180W would need to be added back in.
To correct previous posts:
1. The plot of power (gas and electrical) vs. temperature difference gives HTC = 268.4W/C and power from other sources of 455W (negative of y-axis intercept). Hence the heat loss at a 24-degree temperature difference is 6440W less 180W for hot water gives 6260W, which is very close to the value I calculated via detailed theoretical means considering thermal conduction, thermal bridging, and ventilation losses. The power required for space heating here is 5800W, but note that includes background electricity use, since that was part of the power data used. Subtracting the 290W average electricity use over the 6 month period, gives about 5510W required for space heating and 180W for hot water.
2. The plot of power (gas only) vs. temperature difference gives HTC = 269.3W/C and power from other sources of of 755W (negative of y-axis intercept). Hence the heat loss at a 24-degree temperature difference is 6460W less 180W for hot water gives 6280W, which is only 20W different to the above figures for power from gas and electric. Further, the power from other sources is up by 300W, which is no surprise, since electricity consumption of 290W average is now in the other power sources category. The power required for space heating here is 5530W and 180W for hot water.
3. The plot of power (gas only) vs. degree days gives HTC = 250.3W/C and power from other sources of of 517W (negative of x = -3C line intercept, given my average indoor temperature of 18.5C, and degree days definition of 15.5C). Hence the heat loss at a 24-degree temperature difference is 6000W less 180W for hot water gives 5820W, which is around 450W less than the previous two calculations. Further, the power from other sources is 517W, which is probably an under estimate. The power required for space heating here is 5300W and 180W for hot water.
The issue with using degree days is the implicit assumption that the indoor temperature is constant. I have some ideas and how to improve upon that, which I'll put in another post.
Topic starter
09/09/2026 2:14 pm
Posted by: @cathoderay
I'm not too worried about the DHW tank losses, the tank is like yours in an airing cupboard, but the airing cupboard is in the middle of the first floor, so any tanks losses will mostly end up inside the house, all the more because the rather mobile warped door has a habit of opening by itself!
This sound almost exactly like the arrangement I have, even down to the airing cupboard door that doesn't fit quite right!
I thought exactly the same about tank losses for a while and you're right it's not really wasted heat at all during the heating season. However, in summer the situation is completely different. I didn't want that tank heat loss heating up two already too hot bedrooms even more. The extra insulation around the tank fixed that and gave a decent saving in gas usage over the summer.

09/09/2026 2:22 pm
However, in summer the situation is completely different. I didn't want that tank heat loss heating up two already too hot bedrooms even more. The extra insulation around the tank fixed that and gave a decent saving in gas usage over the summer.
That is a very good point which I hadn't taken into account. I don't mind being warm, but it is wasted energy. Another point is that in winter, the DHW reheats turn off the space heating, and I sometimes see a small IAT dip downstairs because of that, so the fewer the DHW reheats, the better.
Midea 14kW (for now...) ASHP heating both building and DHW
Topic starter
09/09/2026 3:34 pm
Most of the time our hot water heating runs every 48 hours rather than every 24, since with relatively low use it takes that long for the tank temperature to drop 8-degrees (the hysteresis of the thermostat) and trigger the hot water heating again.
Topic starter
09/09/2026 4:19 pm
A refinement of the degree-day method
The degree day method of heat loss calculation is very useful because it only requires smart meter data on daily gas usage, which nearly everyone can obtain, and Met Office degree day data from a nearby weather station, which is again readily available.
The downside is that it is less accurate than using the difference between indoor and outdoor temperatures measured by a home weather station.
The question is what can be done to refine the degree day method to obtain better accuracy, without needing a lot more data. This post attempts to answer that question.
Degree Day method
Recall that the degree day method plots the measured power output of the heating source (PM) against degree day (DD) information typically obtained from local Met. Office data.
The degree-day measure is 15.5C minus the daily average outdoor temperature, i.e. DD = 15.5 – OT, where OT is the outdoor temperature.
In an ideal world, the indoor temperature would be held perfectly constant at its set point, and hence the degree day value would reflect indoor temperature (IT) minus outdoor temperature (OT).
Recall that the balance of heat energy into and out of the house is:
PM = HTC (IT – OT) – PO
Where PO is the power output from other sources.
If the indoor temperature is constant, then we have DD = (15.5 – OT) and IT = K, the constant set point value. Since DD = (15.5 – OT) the above equation becomes:
PM = HTC(DD + K – 15.5) – PO
or
PM = HTC(K-15.5) + HTC(DD) – PO.
Note that the term HTC(K-15.5) is a constant and represents an offset of (K-15.5) degrees on the x-axis of the graph, e.g. 3-degrees in the example above. The slope of the regression line is HTC, and the heat loss is HTC x DT, where DT is the design temperature difference.
This means that all the data points and the slope of the regression line on a graph of PM versus (IT-OT) and a graph of PM versus (DD) are the same, it is just the x-axis scale that is shifted by (15.5 – K) degrees. For example, if the constant indoor temperature is 18.5C, then the point at which the indoor and outdoor temperatures match and the heat loss is zero corresponds to a DD value of -3C, i.e. the vertical line at x=-3C. The negative of the intercept of a regression line with this line gives PO, the average power output from other sources.
The issue
The equation PM = HTC (IT – OT) – PO states that the power output needed to keep the house at some indoor temperature depends on the temperature difference.
Using DD instead of (IT – OT) implies that all that temperature difference is due to changes in outdoor temperature; however, this is not strictly the case. A lower average outdoor temperature can often result in a lower average indoor temperature. This will happen if the heating system is turned off over-night and the house is allowed to cool.
Below is a graph of daily average indoor temperature plotted against daily average outdoor temperature for my house for the period Oct-24 to Mar-25. For these six months, the heating was off between 10pm and 6am every day.
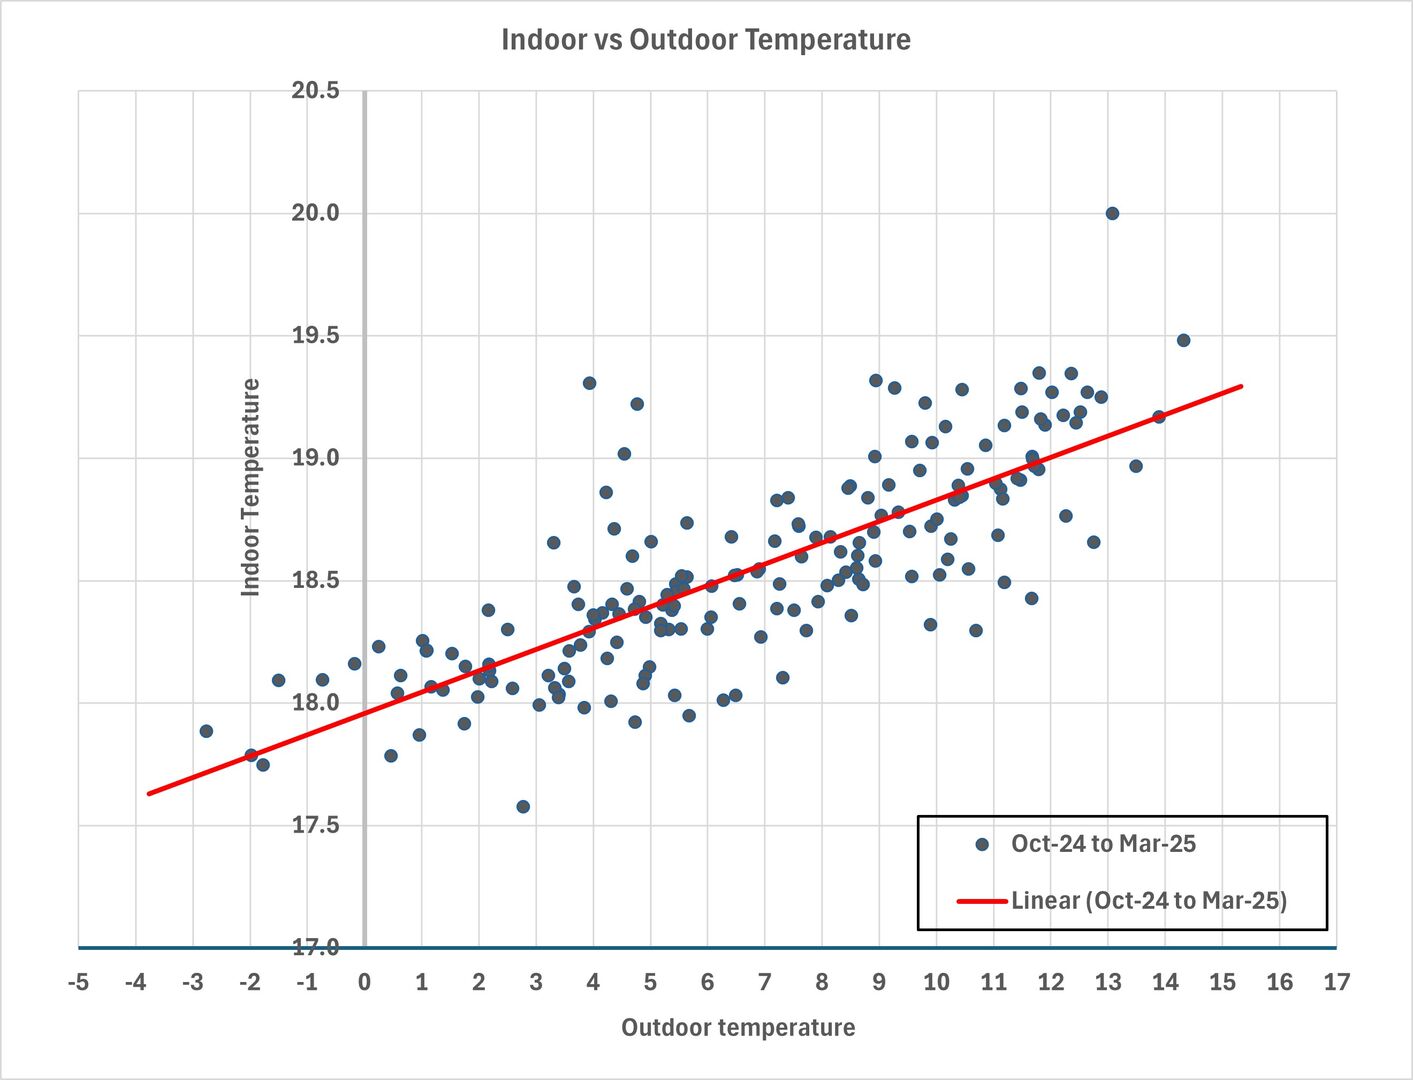
Aside from some outliers, there is a clear trend of lower average outdoor temperatures resulting in lower average indoor temperatures.
Refinement of the Degree Day method
Instead of assuming that the indoor temperature is fixed, we could instead take the view that a theoretical degree-day from the Met Office data of say 20 results in an actual 19-degree temperature difference due to a 1-degree lowering of the average indoor temperature. In other words, we multiply the degree day value by 0.95 and use that value in the plot. This would mean that a degree day value of 20 results in an adjusted value of 19, a DD of 10 would give an adjusted value of 9.5 and so on. This makes sense as a larger degree day value (temperature difference) has a proportionately larger effect on the indoor temperature.
In our house, the heating is off for 8 hours over-night. If it is subzero outside, then the house may cool by as much as 6 degrees in total, i.e. an average of about 3 degrees lower indoor temperature for 8 hours overnight. Taken over a 24-hour period, this equates to a 1 degree decrease in average indoor temperature.
So, what happens if we plot gas power output against 0.95 DD instead of just DD.
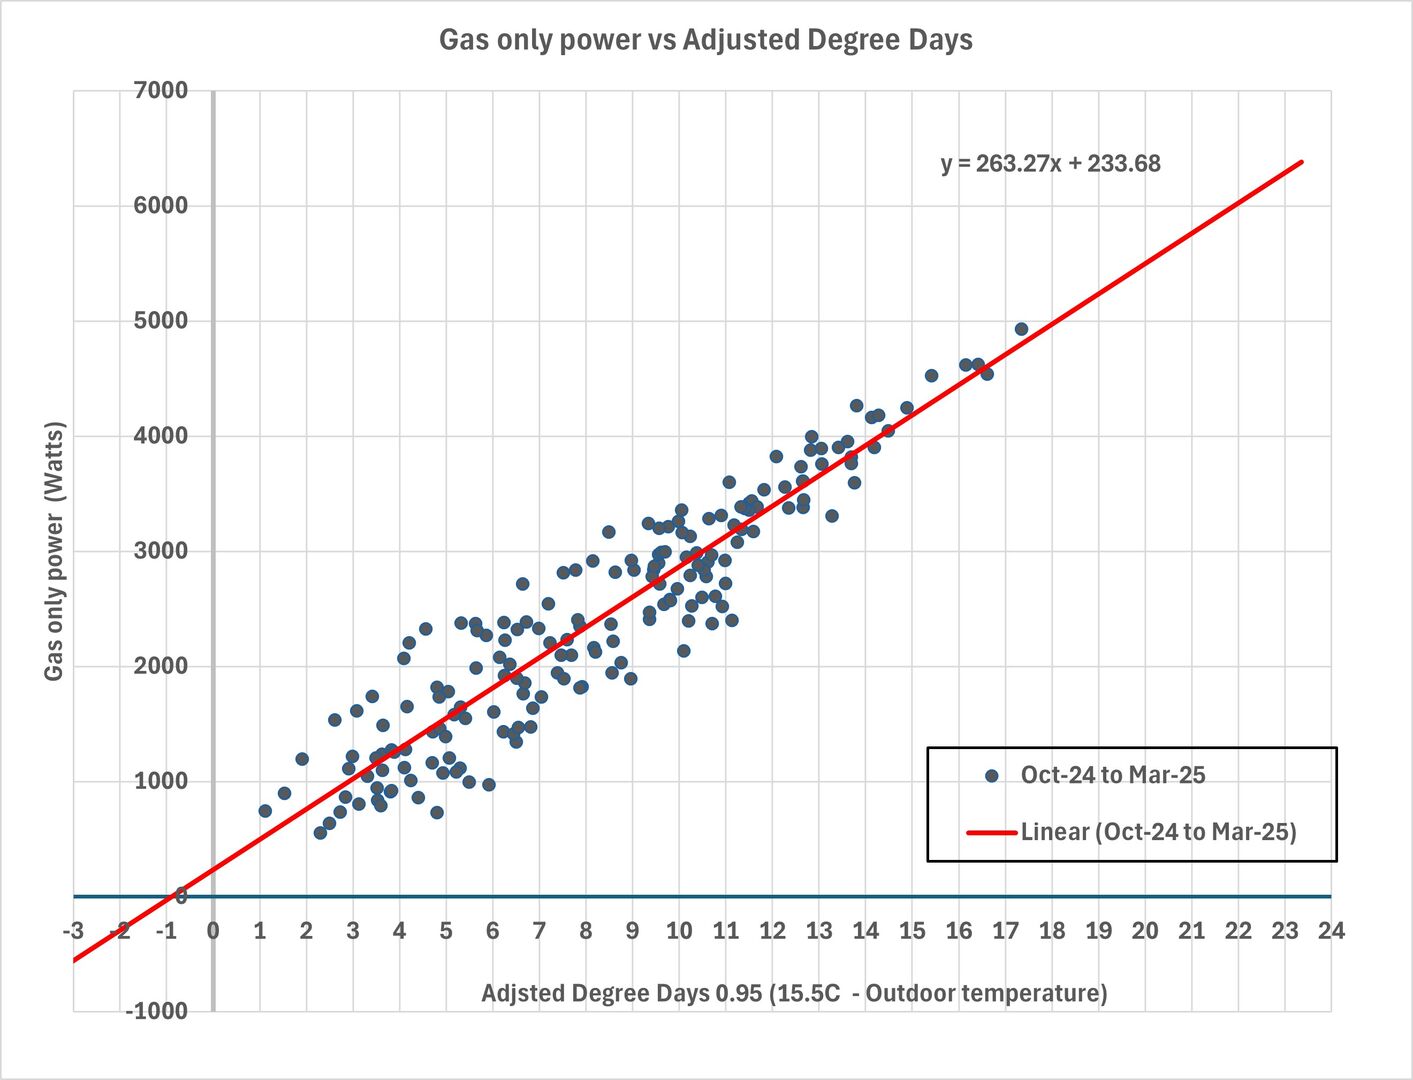
The plot of power (gas only) vs. adjusted degree days gives HTC = 263.3W/C and power from other sources of 556W (negative of x = -3C line intercept, given my average indoor temperature of 18.5C, and degree days definition of 15.5C). Hence the heat loss at a 24-degree temperature difference is 6320W less 180W for hot water gives 6140W, which is less than 150W below the results from previous calculations based on more accurate temperature difference data. The power from other sources of 556W is probably still underestimated here. The power required for space heating is 5580W and 180W for hot water, which is within 100W of the more accurate estimates obtained using temperature differences.
In conclusion, adjusting the degree days by a factor of 0,95 provides a way of accounting for the fact that lower outdoor temperatures tend to feed through into lower indoor temperatures, and are certain to do so if the heating is turned off overnight.
Why pick 0.95 as an adjustment? The logic for that comes from a simple estimate of the indoor temperature loss overnight on a very cold day when the heating is turned off. If a heating system is running 24/7 and is very good at holding the indoor temperature at the set point, then degree days can be used directly. Otherwise, a well-reasoned adjustment to the degree days value can improve the accuracy of heat loss estimation. Certainly, this is the case when the heating system is turned off overnight, as is common practice with gas central heating.
09/09/2026 5:07 pm
Heat loss = HTC x DT. (There is no subtraction of PO in this equation, which I had wrongly included)
Power required for space heating = (HTC x DT) - PO, since the other sources of heat provide some of the power needed.
This was how I understood things, and is why you need to add PO to the primary source contribution (which I will call PP, Power Primary, as opposed to PO, Power Other), to get the total heat loss for IAT - OAT assessments. Given steady state:
Total heat loss = PP + PO
However, HTC x DT measures PP (the Y values that get used in the regression are from the primary source, they do not measure, and can't directly measure, PO), with PP remaining solely the primary heat source's energy contribution. It crosses the X axis at a positive intercept, the point at which PO is sufficient, and at that point, and at lower X axis values, no PP is needed.
Since PP is only the primary source's contribution, we need to add PO to get the total heat loss, but for heat pump sizing we only need PP.
However, put another way:
If total heat loss = HTC x DT
then @rob-of-york's second equation
Primary source power required for space heating (which is I think PP) = (HTC x DT) - PO
which after rearranging becomes
(HTC x DT) (which is the total heat loss) = PP + PO
And put yet another way, the energy vs IAT - OAT assessment is done after the PO has added its contribution, in effect the PO reduces the apparent heat loss the primary heat source has to deal with. To get back to the total heat loss, we need to add back the PO.
It all depends on whether HTC x (IAT - OAT) represents the total heat loss (which includes the contribution from PO) or whether it represents the heat loss that the primary heat source provided after the PO has done its thing. My contention is that it is the latter, because the data used for the regression has no way of knowing what PO is, even if it can be derived indirectly, through the intercepts.
Or perhaps I am just hopelessly confused!
Midea 14kW (for now...) ASHP heating both building and DHW

09/09/2026 5:31 pm
Perhaps best to go back to the basic equation:
L (total loss) = HTC x DT = PP + PO
PP is a function of DT, PO,we are assuming, is a constant. From there you can work everything out.
To your comments:
Total heat loss (L) = PP + PO
Correct
However, HTC x DT measures PP (the Y values that get used in the regression are from the primary source, they do not measure, and can't directly measure, PO),
Not exactly. The slope of PO vs DT (ie d(PO)/d(DT)) is the HTC. This is equal to slope of L vs DT because the first derivative of the constant PO is zero.
Since PP is only the primary source's contribution, we need to add PO to get the total heat loss, but for heat pump sizing we only need PP.
To what do we need to add it to get the loss? YES we do need to add it to PP, NO we dont need to add it to HTC x DT because that is the loss. To get the heat pump sizing we can either take the actual value of PP at the design temperature, or work it out from the loss (in which case we need to subtract PO)
It all depends on whether HTC x (IAT - OAT) represents the total heat loss (which includes the contribution from PO) or whether it represents the heat loss that the primary heat source provided after the PO has done its thing. My contention is that it is the latter, because the data used for the regression has no way of knowing what PO is, even if it can be derived indirectly, through the intercepts.
It represents the total heat loss because thats how the physics works. The data used for regression doesnt need to know PO to calculate HTC, for the reason set out above.
Or perhaps I am just hopelessly confused!
Possibly, and possibly the above doesn't help!
Put another way the equation L = HTC x DT = PP + PO tells you everything you need, rearranged appropriately or differentiated wrt DT.
This post was modified 1 month ago 10 times by JamesPa
4kW peak of solar PV since 2011; EV and a 1930s house which has been partially renovated to improve its efficiency. 7kW Vaillant heat pump.
Topic starter
09/09/2026 5:42 pm
Well I managed to make a mistake with this myself! However, a simple thought experiment convinced me of the correct formulation.
Consider a hypothetical house with no other sources of heat except the primary heating system itself. We go through a heating season, obtain a set of data points, plot them on a graph and draw the regression line. The line conforms to the equation PP = HTC(IT-OT) and hits the y-axis at the origin. The slope gives us the value of HTC, representing teh power needed to support 1C difference in temperature. The heat loss at a temperature difference of DT is then just HTC x DT. All nice and simple!
Now let's do our experiment again, completely repeatable, but with an additional source of heat of a constant 1kW inside the house. Now the primary heating system has exactly 1kW less power that it needs to provide at every temperature difference between indoor and outdoor temperatures. Since this is hypothetical, we repeat exactly the same heating season, all the indoor and outdoor temperatures are the same. The only thing that differs is the primary heating system puts out exactly 1kW less at any given time.
What do the new data points look like on the graph? Answer, exactly the same as the old data points, but the scale on the y-axis has shifted by 1kW. (Note this assumes that none of our original data points required less than 1kW from the primary heating system). The regression line now hits the y-axis at -1kW. The primary heating system puts out 1kW less at any given time relative to the situation without the additional source of heat. However, nothing here changes the slope of the graph. If the temperature difference increases by 1C, then it is the primary heating system that has to provide the extra power equal to HTC. The additional source of heat does nothing different, it just sits there delivering 1kW.
It follows that the building's heat loss is solely defined by HTC, i.e. HTC x DT.
It is only when we want to know the maximum output needed by the primary heating source that we need to know what the assumed constant power from other sources is. We get that via the y-axis intercept of the regression line.
So the primary heating system maximum required output = (HTC x DT) - PO. In other words it equates to the heat loss of the house less the constant power provided by other sources.
I hope that helps.
09/09/2026 5:46 pm
It follows that the building's heat loss is solely defined by HTC, i.e. HTC x DT.
I might argue that this is chicken before egg and that HTC is defined by L/DT not the other way round, but otherwise hopefully your example will help clarify, quite possibly better than my equations.
I cross posted an explanation with the same conclusion above, but that probably just reopens the confusion.
This post was modified 1 month ago by JamesPa
4kW peak of solar PV since 2011; EV and a 1930s house which has been partially renovated to improve its efficiency. 7kW Vaillant heat pump.
Topic starter
09/09/2026 5:47 pm
I just worked on the last post as you were also doing so. Good to see that we are on the same page. Your explanation captures exactly what is going on. Hopefully my thought experiment helps with understanding too. It's quite simple really, as ever just in need of some careful explanation.
1


SPONSORS

Degrees of Separation
Latest Posts
-

RE: How will removing the standing charge on gas bills benefit heat pumps?
I'm not sure it makes much of a difference to heat-pump...
By Temperature_Gradient , 8 hours ago
-
@editor Ouch, sorry to re start the tick. I had assume...
By DavidB , 9 hours ago
-
RE: Say hello and introduce yourself
@e-a-west as the good Major said, welcome to the forums...
By Mars , 10 hours ago
-
RE: New Build 3 Phase or 1Phase
We are on three phase power because it's an enormous li...
By EtchedPixels , 11 hours ago
-
RE: How much of your renewable and home setup would still work if the internet went down?
Yes I actually have a copy of a tool that whenever a ce...
By EtchedPixels , 19 hours ago
-
RE: Indevolt Batteries UK Support & Info Thread
@editor Hi, To resolve this, please tap on the A...
By Indevolt Tech , 1 day ago
-
RE: Double or Triple Glazed Windows?
Posted by: @singlespeed With 9 years repairing windo...
By Rob of York , 2 days ago
-
@transparent we’re still running a secure version of PH...
By Mars , 2 days ago
-
RE: How quickly would you want/expect heat recovery to take from setback?
Much longer than that here. The heating isn't even on. ...
By bobflux , 3 days ago
-
RE: Passiv Smart Thermostat - Help & Forum Support
Obviously the weather is changeable but there's a defin...
By Singlespeed , 3 days ago
-
RE: The Changing Jet Stream Could Challenge UK Air Source Heat Pumps
@rob-of-york I must admit that when we had a Daikin hea...
By Toodles , 3 days ago
-
RE: Forum updates, announcements & issues
Get the Renewable Heating Hub heads-up on WhatsApp. I...
By Mars , 3 days ago
-
RE: Safety study for plug in batteries out to tender - looks like Q3 2027 at best before legal
@editor I pointed out to the one of the Fuse execs that...
By dansus , 3 days ago
-
RE: 15kw pump for 225m2 1990's house - over kill?
@seaviews As well as loft insulation, there are othe...
By Rob of York , 3 days ago




SPONSORS

