

Notifications
Clear all
Joining the Renewable Heating Hub forums is completely free and only takes a minute. By registering you’ll be able to ask questions, join discussions, follow topics you’re interested in, bookmark useful threads and receive notifications when someone replies. Non-registered members also do not have access to our AI features. When choosing your username, please note that it cannot be changed later, so we recommend avoiding brand or product names. Before registering, please take a moment to read the Forum Rules & Terms of Use so we can keep the community helpful, respectful and informative for everyone. Thanks for joining!

Topic starter
22/09/2026 1:56 pm
This post aims to analyse the economics of installing, using, and maintaining various different heat sources based on daily data characterizing the heating requirements and solar PV generation of my house (a 1970s 4-bed detached with as much retrofit insulation as we could reasonably do).
Modelling energy use:
Detailed data was taken from the heating season Oct 2024 to March 2025 when we only had a gas boiler. This included daily gas consumption which was used to compute the heat demand in kWh per day.
Winter electricity use for heating and hot water via an A2W heat pump was modeled at the night rate for 5 hours (5/24th of what was required each day), at the solar export rate for all of the solar PV yield for that day, and at the standard rate otherwise. (The solar PV battery was assumed to provide all of the electricity for background electrical consumption, i.e. non-heating use). Summer electricity use for hot water via an A2W heat pump was assumed to be covered by the night electricity rate, and heating 50-50 by the night rate and solar export rate. Heat pump efficiency was assumed to be 3.8 at a design flow temperature of 42.5C (all radiators replaced) and 3.17 at a design flow temperature of 55C (no radiator replacements); this includes hot water heating (a reduction in SCOP of 0.22 on average according to Heat Geek figures). The same efficiency value was used for every day, which is a little optimistic, since efficiency is lower at colder outdoor temperatures when more heat is required.
For an Air-to-Air (A2A) system complementing gas, winter heating of 4660kWh was assumed at a SCOP of 5.2, as achieved over the 2025/26 heating season when we had A2A in place as well as gas. Half of this was assumed to be at the electricity night rate and the other half at the solar export rate, since our A2A was not run on standard rate electricity. Gas was responsible for all hot water and the remainder of the heating requirement.
Modeling electricity cost:
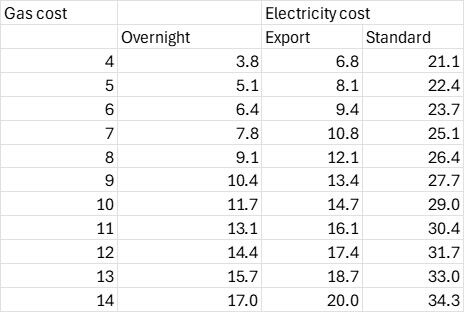
To illustrate the economics of each heat source with changing energy prices, gas and electricity prices were modeled as follows. Different values for the gas price were considered from 4p to 14p per unit. The standard electricity price was modeled as 1.32 times the gas price plus 15.8p. This equates to the relationship between gas and electricity prices as set by Ofgem for the period Oct to Dec 2026, and the fact that the domestic gas price effectively contributes 40% of the price of domestic electricity, with the remaining 60% a fixed cost. This model resulted in the table of prices below. Overnight prices are 1.5p below the electricity price contributed by gas and the solar export price is 1.5p above. (Govt and energy company policy could result in prices that vary considerably from those shown in this table. I have simply gone with a reasonable approximation that matches up with today's pricing).
Capital costs:
The amortized capital costs of installing each heating option were taken over a 17.5-year period (typical life assumed to be 15-20 years). These were added to annual running costs and maintenance costs to give an overall economic cost, which was plotted on a graph for gas prices varying from 4p to 14p. These gas prices defined the corresponding electricity prices via the table above. Where new radiators were assumed, their capital costs were amortized over a 35-year period, representing the much longer lifespan of these passive components. Total installation costs assumed were £10250 for the A2W heat pump, £4000 for radiators, £3000 for a gas boiler and £3300 for A2A. The BUS grant was assumed to be £7500.
Results:
A number of different systems were considered including an A2W heat pump with and without radiator upgrades, a combination of gas boiler and A2A system, and gas alone. Further, different cost bases were considered including the full economic cost (FEC), the BUS grant, and whether the system was already in place i.e. disregarding the sunk costs of existing equipment that would be discarded but otherwise did not need to be replaced.
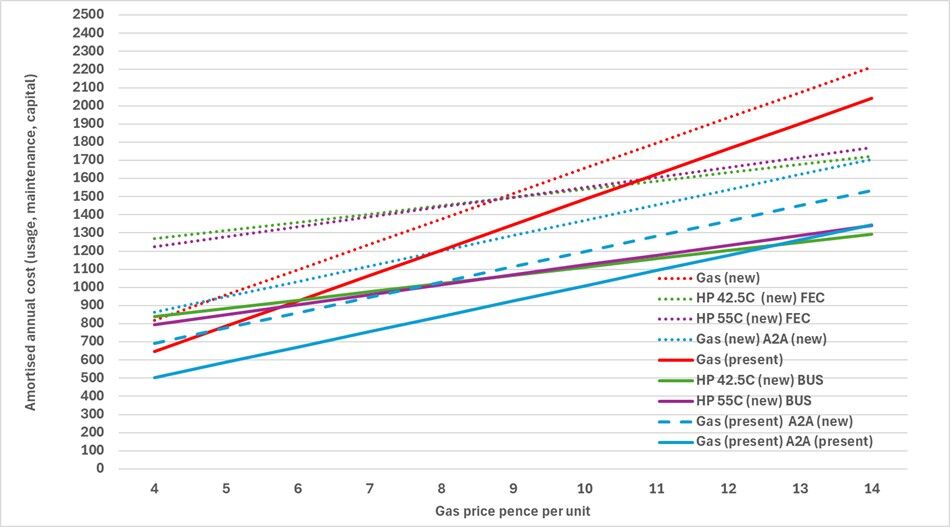
The dotted lines on the graph illustrate the Full Economic Cost (FEC) of installing a new system of the various types: Red – gas boiler, Green – A2W heat pump and new radiators (42.5C flow temperature), Purple - A2W heat pump with existing radiators (55C flow temperature), Blue – A2A and gas boiler.
Conclusion 1: Where an existing heat source must necessarily be replaced and the Full Economic Cost of any replacement met, A2A and a gas boiler (dotted blue line) is the most economically effective for all gas prices from 4.5p per unit to 14p per unit. (A gas boiler alone is marginally cheaper when gas is 4p per unit).
The solid green and solid purple lines show the effect of the BUS grant (as compared to the dotted lines of the same colour).
Conclusion 2: Where an existing heat source must necessarily be replaced and the BUS grant is available for A2W heat pumps, A2W with and without radiator upgrades (solid green and purple lines) are very close in amortized costs and the most economically effective for all gas prices from 4p per unit to 14p per unit. Choice here depends on whether the capital cost of new radiators can be met and the life remaining in the old ones.
The solid red line represents a nearly new gas boiler that does not need replacing. Similarly, the solid blue line represents a nearly new gas boiler and A2A system that do not need replacing. Finally, the dashed blue line, represents adding a new A2A system to a nearly new gas boiler that does not need replacing.
Conclusion 3: Where only a nearly new gas boiler is present (red solid line), for gas prices over 6p per unit, the BUS grant makes it economically viable to replace it with an A2W heat pump with or without new radiators (green and purple solid lines). For gas prices under 7p per unit adding an A2A system is however a more economical alternative (dashed blue line).
Conclusion 4: Where a nearly new gas boiler and A2A system is present (solid blue line), simply retaining it is economically the best option for gas prices below 13p per unit. At higher gas prices, the BUS grant makes an A2W heat pump with a radiator upgrade marginally more cost effective (solid green line).
Conclusion 5: Given that the BUS grant cannot plausibly subsidize A2W heat pumps for all, when it stops the economic alternative for many people with existing Solar PV will be partial decarbonization via the addition of an A2A system to complement their gas boiler. This will have the advantages of providing both cooling and heating system redundancy, as well as not requiring a large subsidy through taxation or higher energy prices to make it financially viable.
Note, the Govt. Energy Price Guarantee limited the gas unit rate to 10.3p from Oct 2022 to June 2023, so prices well above that level may be unlikely due to Govt interventions to avoid them.
Topic starter
26/09/2026 3:31 pm
Playing some what-if games with the numbers. If the Govt. were to remove all of the levies from electricity unit prices, i.e. a 4.2p reduction, and gas prices were to increase to around 12p per unit with standard rate electricity prices then around 27.5p, the spark gap would be just 2.3. If that situation persisted then installing an A2W heat pump (under the BUS grant) as a replacement for my existing gas boiler would be break-even in economic terms compared to simply keeping my gas boiler and A2A system as they are now.
The difficulty in justifying an A2W heat pump in my case is that a substantial amount of my heating is already done very efficiently by A2A and so the savings replacing the remaining 8000 units of gas that are used is really quite limited. Further, the A2W heat pump has to be sized in order to cover the entire heat loss of the property. This is a stipulation of the BUS grant, as well as a perfectly reasonable requirement in this case.
Using £7500 of energy bill payers subsidy (the BUS grant) to achieve a saving of around 1500kg on CO2 emissions per year (from 8000 units gas use assuming zero-emission replacement electricity) for a 17.5 year period is also not good environmental economics. This equates to over £285 per tonne of CO2 removed, which is substantially higher than the current UK carbon price of around £50 to £60, expected to rise to £100 in the 2030s. This indicates that there are far more cost effective means to reduce carbon emissions that are readily available.
Giving the BUS grant to someone who can save 24000 units of gas rather than 8000 units would make far more sense. Better still, giving £1500 to 5 different households as a maximum 50% contribution to the installation of an A2A system alongside their gas boiler would greatly increase the take up of those systems, and result in a much larger reduction in CO2 emissions. Five households like ours could save a total of 32000 units of gas per year in that way, or about 6000kg of CO2. Over a 17.5 year period, that equates to less than £72 per tonne of CO2 saved, which is far more competitive.
This brings me to the final conclusion. For now, my journey towards getting an A2W heat pump is over. More likely on a long pause rather than completely ended. Having A2A already installed negates both the financial case and the environmental case for an A2W replacement of my fairly new gas boiler even accounting for the BUS grant, significantly higher gas prices (above the level at which the Govt. saw fit to limit prices in 2022/3), and a reduction in Govt. levies on electricity. The money from the BUS grant could be better used elsewhere, including subsidizing A2A without the need for gas boiler removal.

26/09/2026 4:59 pm
Very sound analysis, albeit for a currently relatively rare situation, but one that may get much more common as people fit Aircon and then realise it can be used for heating too!
This post was modified 2 weeks ago by JamesPa
4kW peak of solar PV since 2011; EV and a 1930s house which has been partially renovated to improve its efficiency. 7kW Vaillant heat pump.
1
Topic starter
27/09/2026 1:56 pm
It's interesting that Norway with a much colder climate than the UK has the most heat pumps per 1000 households of any European country, at 632 in 2024, compared to just 19 for the UK. Over 90% of these household heat pumps in Norway are Air-to-Air systems used for heating.
1



29/09/2026 8:54 pm
I had a meeting today with a company based out of Sweden and we spoke about heat pumps (obviously 😆) and it was interesting because the lady on the call said that ground source adoption in Sweden was massive.
🔥 Britain’s Heat Pump Shitshow
How Installing a Heating System Became a National Nervous Breakdown
Free UK shipping.
📗 Heat Pumps Explained
A Jargon-Free Guide for Homeowners
Rewritten and updated for 2027
📘 From Zero to Heat Pump Hero
🛠️ Bodge Buster
New to heat pumps?
Take the Heat Pump Fundamentals course and use INTRO50 at checkout for 50% off.
1

SPONSORS

Degrees of Separation

Latest Posts
-

The video in the link mentions a direction arrow, which...
By Singlespeed , 1 hour ago
-
RE: Cooling/heating with one unit
@rob-of-york thank you. Hadn't occurred to me that some...
By mrkfm , 4 hours ago
-
RE: Renewables & Heat Pumps in the News
Posted by: @editor I think we should make that approa...
By Rob of York , 10 hours ago
-
RE: Does anyone have experience of a smart water meter?
My neighbour received an email from Anglian Water sayin...
By AndrewJ , 11 hours ago
-
RE: Jokes and fun posts about heat pumps and renewables
Well the military is well known for going green, isn't ...
By Majordennisbloodnok , 12 hours ago
-
RE: Why are ASHP installs so expensive?
I've ripped out over 11kw of storage and panel heaters ...
By Singlespeed , 13 hours ago
-
RE: Safety study for plug in batteries out to tender - looks like Q3 2027 at best before legal
I think it may depend how much of the world is on fire ...
By EtchedPixels , 20 hours ago
-
RE: Air-to-Air Heat Pumps & Air Conditioning: UK Heating and Cooling Q&A
I hope it's not the same people who make the awful TV s...
By EtchedPixels , 21 hours ago
-
RE: Replacing Storage Heaters with a Heat Pump in a Stone Cottage
I found some interesting data about the price of heat p...
By Rob of York , 1 day ago
-
RE: PV and battery long payback - sense check query
Thanks for all the comments. I finally got to the bott...
By DavidB , 2 days ago
-
RE: Indevolt Batteries UK Support & Info Thread
People following this thread who are hoping that plug i...
By JamesPa , 2 days ago
-
RE: Passiv Smart Thermostat - Help & Forum Support
By Singlespeed , 2 days ago
-
RE: Help me keep the faith with my air source heat pump installation
just had Vaillant over to service the HP and asked abou...
By AdamK , 2 days ago
-
RE: tepeo ZEB UK Support & Info Thread
OK so ZEB is basically a variant on a storage heater, b...
By JamesPa , 3 days ago





SPONSORS
