@scrchngwsl - I started by looking at the regression. As I through habit like to see plots, I have done (a) a scatter plot with the regression line, (b) a residuals plot and (c) a Q-Q plot:
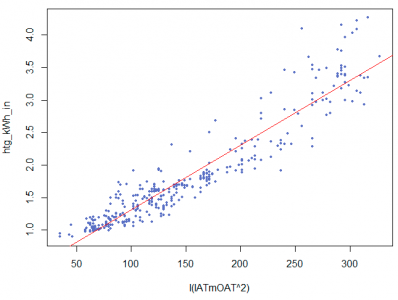
First the scatter plot:
This looks OK(ish). I also got an R squared value of 89%, which is in the accetable(ish) range. Over 90% is OK so 89% is good enough.
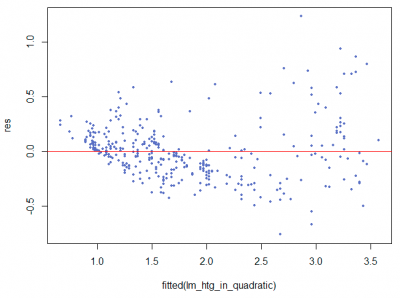
Next the residuals:
These aren't quite as I would have liked, possibly some flaring, and possibly not evenly spread.
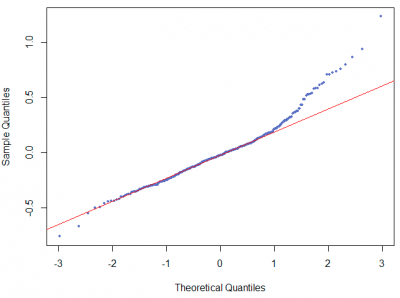
Lastly the Q-Q plot:
This is not ideal, given the marked divergence at the upper right end of the plot, suggesting the data are not normally distributed.
This may or may not matter, depending on how your code applies the regression equation to the setback days. In my method, I rely, having shown it to be the case, on the data being normally distributed, so I can rely on 'the mean has meaning', see past posts for further explanation if this doesn't make sense.
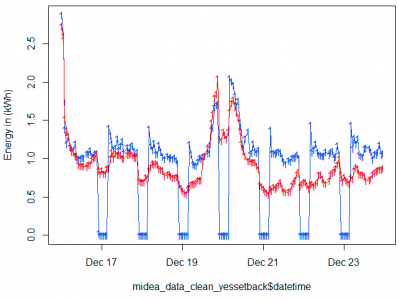
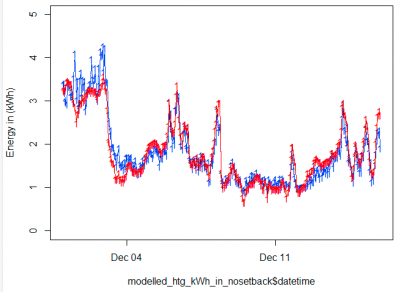
Next I plotted the observed vs expected (from your regression based predictions) values during the setback period, and got this (blue line is observed, red line is expected):
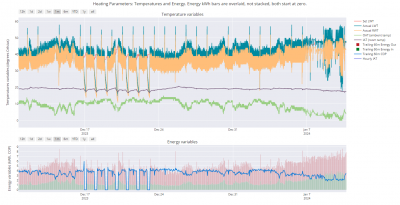
Assuming I have done the plot correctly, this does not look right to me. The expected (predicted) values are often much less than the observed values, potentially obliterating, or even reversing, any setback savings. Consider what actually happened over the last month, which includes the setback period:
Look at the period around the 27-28th Dec, when the OAT (as measured) was in the same ballpark as it was during most of the setback period, around 10-12 degrees, then look at the energy in for that period, the values hover at something just over 1 kWh per hour. The IAT is of course different, steadier, and a slightly higher overall average, but nonetheless, it suggest the ballpark energy in is around is just over 1 kWh per hour in those conditions, whereas the predictions from your modelled data are notably below that.
I'm presenting all this for discussion, not as the done and dusted answer.
Midea 14kW (for now...) ASHP heating both building and DHW
Posted by: @derek-mI think that if the data under the volts and amps columns are integers in the file provided by CR, it will be raw data without the 1.18 correction factor having been applied. I merely added an additional column and performed the V x I calculation.
@derek-m is correct, the data in the minute data file is raw as collected data without the correction, the calculated values in the hour data file have the correction applied. I apologise for not making this clearer, and being misleading by referring to 'amps_in' which is in the minute data file.
Midea 14kW (for now...) ASHP heating both building and DHW
Posted by: @derek-mJust to recap.
You issued philosophies and data for peer review, also indicating that quite large reductions in energy consumption can be achieved by utilising an overnight setback operating regime.
When I try to review your philosophies and data I find that to do so correctly I need further information, which I politely request. Rather than provide the missing information, you suggest I perform the same calculations that you performed to test your methodology, but to do so I find that I now need clarification of the data upon which you performed your calculations, which I again politely request.
Rather than provide the requested detail so that the necessary peer review can be performed, you suggest I use some unspecified data, with the caveat that any results I obtain would probably not be the same as your previous results.
I fail to see how this is peer review.
I also don't understand your reluctance to respond to perfectly valid requests for further information and/or clarification of information already supplied.
I'm afraid I've lost you here. I have posted the complete data set for December 2023. I've just issued a prompt correction and apology for suggesting wrongly earlier the amps_in data already had the correction factor added (I'm only human, I do make mistakes, and readily admit them when they happen). I'm not sure what 'the missing information' is - you have all the data.
It would be very helpful if you could do another recap, specifying what data/information/clarification it is that you require, and I will do my best to provide it.
We really don't need to have yet another pointless and boring row about what peer review is, we both know full well what it is.
Midea 14kW (for now...) ASHP heating both building and DHW
Posted by: @cathoderayPosted by: @derek-mJust to recap.
You issued philosophies and data for peer review, also indicating that quite large reductions in energy consumption can be achieved by utilising an overnight setback operating regime.
When I try to review your philosophies and data I find that to do so correctly I need further information, which I politely request. Rather than provide the missing information, you suggest I perform the same calculations that you performed to test your methodology, but to do so I find that I now need clarification of the data upon which you performed your calculations, which I again politely request.
Rather than provide the requested detail so that the necessary peer review can be performed, you suggest I use some unspecified data, with the caveat that any results I obtain would probably not be the same as your previous results.
I fail to see how this is peer review.
I also don't understand your reluctance to respond to perfectly valid requests for further information and/or clarification of information already supplied.
I'm afraid I've lost you here. I have posted the complete data set for December 2023. I've just issued a prompt correction and apology for suggesting wrongly earlier the amps_in data already had the correction factor added (I'm only human, I do make mistakes, and readily admit them when they happen). I'm not sure what 'the missing information' is - you have all the data.
It would be very helpful if you could do another recap, specifying what data/information/clarification it is that you require, and I will do my best to provide it.
We really don't need to have yet another pointless and boring row about what peer review is, we both know full well what it is.
I fully agree that making derogatory statements about other forum members is to be avoided.
Please provide the actual values, for both the blue and the red trace, that were used to produce the chart that indicated a 22.9% reduction in electrical energy input when a overnight setback is operated.
@scrchngwsl - a little more information, from the no setback period. I have calculated (using your code adapted for the no setback period) and plotted the observed (blue) vs predicted (red) values and get this:
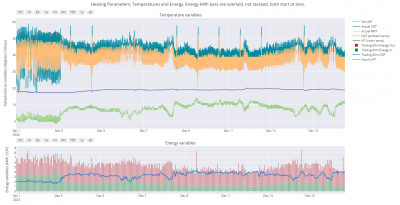
ie pretty good agreement, the model is working. This is also what happened with @derek-m's model, worked outside the setback, appears to under-predict during the setback period. This of course raises the question, am I (using my regression model), over-predicting? Of course it is possible, but I don't think it is the case. Consider this, which covers the no setback period you used:
Note the period around the 10-11th Dec, fairly steady OAT (as measured) at around 10-11 degrees, and then the energy in for that period, just a bit over 1 kWh per hour. This is consistently what gets recorded, and I think it is reasonable to say 1 kWh per hour at 11 degrees OAT (as measured) is a fair estimate of use at these conditions. Now here is the setback R plot again:
What we see here, when the OAT (as measured) was around 11 degrees (see previous chart above), apart from a dip in the middle of the period, is an observed (blue) line that is mostly consistent with the 1 kWh per hour at 11 OAT (as measured) guideline, apart from the visible recovery boost peaks immediately after the setbacks, yet the red expected line, based on your model, is a lot of time well below 1 kWh per hour (on the 21 Dec it drops down to between 0.5 - 0.6 kWh per hour), ie well below expectations based on other periods. In the absence of a better explanation, I have to suggest that those values, for reasons that are not apparent, at least to me, are not credible.
I hope we can work constructively to make sense of all this.
Midea 14kW (for now...) ASHP heating both building and DHW
Posted by: @derek-mPlease provide the actual values, for both the blue and the red trace, that were used to produce the chart that indicated a 22.9% reduction in electrical energy input when a overnight setback is operated.
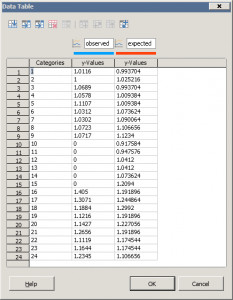
Here's the data table from the actual chart:
Don't forget I never claimed this chart was the answer to everything. In the paragraph immediately under it I clearly stated:
"This suggests a 6.06 kWh saving over the 24 hour period, or 22.91% saving over the expected (predicted) value. Clearly this is just one isolated 24 hour period, result seems optimistic etc etc etc, I post it just to show the method, not as long times series covering many days. In practice, for longer times series, the chart isn't needed, the 24 hour sum data only needs a pivot table to collect it. "
I summarised the findings (and used 'suggests' rather than 'shows'), and then made it very clear (I even used italics) I was demonstrating a method, not proving a result.
Midea 14kW (for now...) ASHP heating both building and DHW
@cathoderay I've made a few modifications having looked through your posts.
First, the problem with applying the "no setback" model to the "yes setback" period is that the model depends on the IAT. What my original model showed is what the kWh_in would need to be to keep the house at the same IAT as you had during the setback period. But the whole point of a setback period is to reduce the average IAT across the day, such that the total required heating for the house is less. In other words, the IAT during the setback days ought to be lower than the IAT during the non-setback days, and therefore the heating requirement will be lower. Consequently, by using the actual IAT during the setback period and plugging that into the model to use as predictors, we don't see the effect that we're looking for (instead we just see noise). So instead, I've used the average IAT for the "daytime" hours -- that is, for the times of the day when you want heat -- as the predictor for the setback period.
The second change is to compensate for the fact that you appear to have a cold well, which makes the ambient temperature spike during the first hour that you employ the setback, and then remain kind of high throughout the remainder of the setback. This results in the OAT rising, and therefore my model thinking that we don't need to put as much heat into the house. But of course, that's just because, in real life, you've turned off the heat pump, so it's no longer pumping out cold air, so the ambient temperature recorded by your heat pump rises. So instead of using the ambient temperature during the setback period, I'll take an average of the ambient temperature during the final hour prior to the employment of the setback (this is essentially the temp at 9pm) and the ambient temp during the first hour following the resumption of the heat pump (4am). This should make the saving due to the setback clearer (i.e. larger).
The third change, which I had hoped would make the diagnostic plots look a bit better around the edges but didn't do much really, was to change the model formula from IATmOAT^2 to IATmOAT^2/(MD02_tmp + 273). My original ^2 relationship was a bit of a simplification, as the COP ought to be proportional to IAT/(IAT-OAT) with everything in Kelvin, rather than simply 1/(IAT-OAT). I had hoped that adding the extra term (which contains +273 cos we want it in Kelvin) would have made it more robust to data that sits on the extremities, but it didn't really.
One problem that I've noticed is that, in fact, when you look at the data, your COP isn't proportional to 1/(IAT-OAT) or IAT/(IAT-OAT) at all. It's simply proportional to 1-(IAT-OAT) -- which I can't understand. Unless I'm being dense, that doesn't make sense to me -- how can the relationship be linear? It implies negative COPs at some OATs! But that's what your data seems to show. I've ignored that for now but I suspect that the funny extremities on the diagnostic plots are down to this. (Again, unless I'm being dense.)
Anyway, the result of those changes now is that employing a setback saves 6.3% vs the modelled estimate without a setback. I'd call that significant personally (if I could save £6 a month on my energy bill surely I would), but not earth shattering -- and certainly not physics destroying. I'd call that a win for the setback. Again, assuming there's nothing else I've missed, which I'm sure there is.
Here is the code:
# midea hourly modelling
library(tidyverse)
library(lubridate)

midea_data_raw <- read_csv("midea_hr_data_dec_2023.csv")

# only include data from before setback enabled, and isn't doing DHW
# also add a column for IAT-OAT
midea_data_clean_nosetback <- midea_data_raw %>%
  filter(dhw_kWh_out == 0,
         datetime < "2023-12-16T00:01:01") %>%
  mutate(IATmOAT = MD02_tmp - ambient)

# fit the model
lm_htg_in_quadratic <- lm(htg_kWh_in ~ I(IATmOAT^2/(MD02_tmp + 273)), data = midea_data_clean_nosetback)
summary(lm_htg_in_quadratic)
plot(lm_htg_in_quadratic)

# now let's look at the setback days
# we need a different "IAT", however, as the point of the setback is to
# reduce the average IAT! so let's use the average IAT from the "daytime" hours
# and just use that for the whole day. This won't be accurate hour-by-hour, but
# it should average out over the course of the day.
# we also need to correct for the ambient temp during the setback hours being
# too high, because the HP is off and the cold well is no longer there.
midea_data_clean_yessetback <- midea_data_raw %>%
  filter(dhw_kWh_out == 0,
         datetime >= "2023-12-16T00:01:01",
         datetime < "2023-12-24T00:01:01") %>%
  group_by(day(datetime)) %>%
  mutate(IAT_avg = sum(MD02_tmp * (htg_kWh_out > 0.1)) / sum(htg_kWh_out > 0.1),
         ambient_measured = ambient) %>%
  ungroup() %>%
  mutate(ambient_modified = ifelse(htg_kWh_out < 0.1, NA, ambient_measured),
         last_ambient = lag(ambient_modified),
         next_ambient = lead(ambient_modified)) %>%
  fill(last_ambient, .direction = "down") %>%
  fill(next_ambient, .direction = "up") %>%
  mutate(ambient_modified = if_else((htg_kWh_out < 0.1), (last_ambient + next_ambient)/2, ambient_measured),
         IATmOAT_modified = IAT_avg - ambient_modified,
         IATmOAT_measured = MD02_tmp - ambient_measured,
         IATmOAT = IATmOAT_modified)

# apply the model to the setback period
modelled_htg_kWh_in_yessetback <- data.frame(
  midea_data_clean_yessetback,
  modelled_kWh_in_quadratic = predict(lm_htg_in_quadratic,
                                      midea_data_clean_yessetback)
)

# compare actual with modelled kWh usage
modelled_htg_kWh_in_yessetback %>%
  summarise(htg_kWh_in = sum(htg_kWh_in),
            modelled_kWh_in = sum(modelled_kWh_in_quadratic)) %>%
  mutate(setback_saving_percent = modelled_kWh_in / htg_kWh_in - 1)

ggplot(modelled_htg_kWh_in_yessetback,
       aes(x = datetime)) +
  geom_line(aes(y = htg_kWh_in), colour = "blue") +
  geom_line(aes(y = modelled_kWh_in_quadratic), colour = "red")
ASHP: Mitsubishi Ecodan 8.5kW
PV: 5.2kWp
Battery: 8.2kWh
Thank you for providing the requested data.
A quick first examination appears to show some anomalies that don't appear to follow known and accepted heat pump performance.
The first 9 hours of data are apparently without a setback having been performed during the previous days, so it would be expected that the observed energy consumption would be replicated to reasonable accuracy by the expected value, but the total of the expected values is 1.04kWh higher than the observed total, which equates to an increase of 12.4%.
There is obviously no meaningful comparison that can be made during the setback period, where the expected value is calculated to be 6.2kWh.
The remaining 9 hours after the setback would indicate that the observed energy consumption is hypothetically just 0.14kWh higher than the expected value, or conversely the expected consumption is only 0.14kWh less than the observed value when the heat pump will be performing a post setback boost.
Something does not appear to be correct.
@scrchngwsl - thanks very much for putting so much effort into this, and detailing your reasoning, and posting your code. I will post mine once I have tidied it up (it was done by trial and error in the console, lots of redundant lines that can be removed).
Posted by: @scrchngwslBut the whole point of a setback period is to reduce the average IAT across the day, such that the total required heating for the house is less.
This is indeed the bedrock of the common sense reason for believing that setbacks should reduce overall energy use. To me, on the face of it, it doesn't offend the laws of physics, if you keep something cooler on average, then you use less energy than if you keep it cooler. But then again, we all know that common sense can be fallible, and that is why we try to quantify the saving, accepting (but not expecting) that the analysis might even produce a paradoxical result, that setback actually uses more energy. But that is so counter-intuitive that any argument suggesting it is the case needs to be more than ordinary bomb proof, it needs to be nuclear bomb proof.
I will run your revised code, and see how I get on. I have various other commitments today, so progress will be a bit piecemeal.
I'm looking forward to reading @jamespa's thoughts on your approach as well, I am sure he will have something interesting to say.
Midea 14kW (for now...) ASHP heating both building and DHW
Posted by: @derek-mA quick first examination appears to show some anomalies that don't appear to follow known and accepted heat pump performance.
I said when I first posted it and I have repeated it again, and will now repeat it for a third time, it is not meant to be an answer, let alone a definitive answer, instead it was and remains just a 24 hour snippet to demonstrate the method: collect the observed values during setback, calculate the expected values without setback, sum each over 24 hours and then calculate the difference, and that is you saving (or not, if there isn't one). It's a demo of the method, and nothing more.
It is far more useful to look at longer time frames, using both graphical and numerical approaches.
Midea 14kW (for now...) ASHP heating both building and DHW
Posted by: @scrchngwslAnyway, the result of those changes now is that employing a setback saves 6.3% vs the modelled estimate without a setback. I'd call that significant personally (if I could save £6 a month on my energy bill surely I would), but not earth shattering -- and certainly not physics destroying. I'd call that a win for the setback. Again, assuming there's nothing else I've missed, which I'm sure there is.
Posted by: @cathoderayI'm looking forward to reading @jamespa's thoughts on your approach as well, I am sure he will have something interesting to say.
Thanks for the vote of confidence, Im not sure its justified.
I think the challenge here is that we are comparing a model in one condition with with actual in another, both in the way @cathoderay does it and the way, if I understand it correctly, @scrchngwsl does it. This is always going to be a little iffy because the model will inevitably leave out some features of the actual so we aren't comparing like with like. That's why I personally, when its possible, prefer to compare model with model or actual with actual, and then compare model with actual but in similar conditions. I realise however that this isn't always practical and above all am a pragmatist when it comes to these things.
Having said that both comparisons are excellent pieces of work and I commend you on them. I haven't fully understood @scrchngwsl method, but it seems to be well rooted in physics and rely less on empirical relationships that @cathoderay does, which in general is probably good. Also a method to compensate for the distorting effect of the well is good, whilst it is true that the intake sensor sees the colder air from the well, the house does not and the heat loss from the house is determined by the general OAT not the well OAT (the efficiency of the heat pump, on the other hand, is determined by the well OAT).
But much better still than any of this, we now have two ways of estimating the saving and the spread between the two tells us something about the accuracy of both! That is really valuable. Furthermore a ~6% saving is broadly consistent with my very crude theoretical estimate, @derek-m s modelling and an estimate based on 'ignore the fact its a heat pump just work out the change in energy lost from the house'. That makes it more believable as a ballpark estimate of what one might expect in a tolerably well adjusted system in the conditions modelled (with the usual cautions).
I haven't had the time to do anything concrete in recent days, and probably wont get the time to do so in the next few days. I have a notion however that its possible to write down and maybe even solve the equations that describe the effect of a mild setback, relying on conservation of energy only (which of course is a sound basis). That's what I am currently trying to do. Of course someone else may well beat me to it, as it will probably take me a couple of weeks on and off to get there. Im having to learn libre office equation editor at the same time as my handwriting is too poor to be a practical way of setting out more than about two equations at a time.
4kW peak of solar PV since 2011; EV and a 1930s house which has been partially renovated to improve its efficiency. 7kW Vaillant heat pump.
- 26 Forums
- 2,396 Topics
- 54.3 K Posts
- 256 Online
- 6,077 Members
Join Us!
Worth Watching
Latest Posts
-
RE: Recommended home battery inverters + regulatory matters - help requested
This is a typical/higher consumption day, the main acti...
By Batpred , 11 minutes ago
-

RE: Running from backup generaor in powercut?
Right on topic, Storm Goretti has done its thing and we...
By Mars , 21 minutes ago
-
RE: Help me keep the faith with my air source heat pump installation
@simonf I’ll ask the installers to get them out. What k...
By AdamK , 8 hours ago
-
RE: ASHP Energy Consumption: Aira 12kW heat pump
I doubt that matters, ToU tariffs are for the benefit o...
By JamesPa , 16 hours ago
-

RE: Free Ecoheat Heat Pump Install
@deltona Yes older houses are problematic like that, bu...
By bontwoody , 19 hours ago
-
RE: Radiator sizing sanity check
As I mentioned early on the cost of supplying and fitti...
By JamesPa , 21 hours ago
-
RE: Advice for a novice on Mitsubishi Ecodan 6kW
I hadn't spotted that there were two pumps in the UFH (...
By JamesPa , 23 hours ago
-
RE: Setback savings - fact or fiction?
Never assume it makes an ass of u and me! You need the...
By JamesPa , 23 hours ago
-
RE: New Mitsubishi Ecodan 11.2kW installation - L9 errors and maybe more
Before I answer your specific questions just one more t...
By JamesPa , 23 hours ago
-
RE: Electricity price predictions
Great point, one of the key ones in my chat with Octopu...
By Batpred , 1 day ago
-

RE: New Fogstar 15.5kWh upright solution
Let me point out that there are many Chinese suppliers ...
By Transparent , 2 days ago
-

RE: Weather compensation- why you should use it
@majordennisbloodnok — The Two Ronnies Mastermind sketc...
By cathodeRay , 2 days ago
-
Just realised that this image of the cylinder cupboard ...
By Sheriff Fatman , 2 days ago
-

RE: Rodents! A word of warning for heat pump owners
Two thoughts: 1: Let's ask @david-s if Primary Pro in...
By Transparent , 2 days ago
-
RE: Solis S6-EH1P8K-L-PLUS – Why I Chose It and What I’ve Learned So Far
In the diagram below, I describe my understanding of th...
By Batpred , 2 days ago
-
I need to have a look out for it. I know IBM feeds some...
By Batpred , 2 days ago
-
-
RE: Daikin Atherma ASHP Cycling 6 Times an Hour?
Thanks for your reply. Yes that's a good idea to try a...
By John Marshall , 2 days ago
-

RE: Hot water heating in parallel with space heating
An external heat exchanger would need a pump which woul...
By bontwoody , 2 days ago
-
RE: Gen 6 Samsung ASHP losing 20C of DHW in 60 min directly after generation
@ecobaker Thanks for this. I've had it in both slots. ...
By andbeck , 2 days ago

