Posted by: @bensonWhat I didn't quite expect (or understand perhaps) is that the warmer end temp on the weather curve is actually where heating will disable e.g. WCC warm end parameter set at 16 degrees C, and rather than just continuously running at whatever the set LWT is at that point for 16 and above, it will actually just...turn off. Which works rather well as it happens.
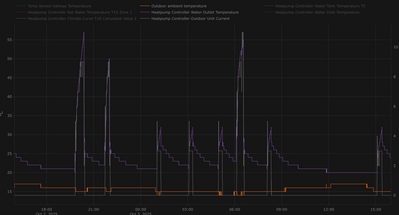
Interesting. I have always assumed, partly because the chart of the WCC in the Midea Engineering Data manual suggests it is so, that at OATs above the right hand set point, the LWT is the same as at the set point ie 30 @ 15 degrees actually 30 @ 15 degrees and above. Ditto at the other end, 50 @ -2 actually means 50 @ -2 or less degrees. True turning off at higher OATs happens not because of the WCC, but because the OAT is higher, and the room stat turns the heating off, as happens in summer. But your chart dies suggest the heat pump stopped producing heat at around 1000 on the 29th. Rather curiously, the LWT actually falls below the IAT, I wonder how it does that? The chart would benefit from also showing the OAT (and the Y axis could range from 0 to 60 rather than -60 to 100, to give a better perspective). Charting the set as well as actual LWT might also provide more information.
Her's my chart for the last two days. I think it bears out the above ie at 15 degrees and above OAT, the set and actual (average) LWT is 30, ie the heat pump doesn't turn off. That will only happen if I dial down the room stat, or otherwise fully turn off the heating:
Posted by: @papahuhuWouldn’t interfacing the heat pump with an unapproved control wholly void the warranty?
I agree with @benson - we are using the manufacturer's interface, as documented in the publicly available manuals. The availability of that information is meaningless if we can't make use of it. Or to put it another way, they shouldn't be at all surprised if we use the information if they make it available!
Midea 14kW (for now...) ASHP heating both building and DHW
@cathoderay that is so odd. I wonder why mine does this. There's no doubt that mine does this as I've been closely watching it as well over the last couple of days as as soon as we are 16 and above, it will stop heating. There are two time periods on my graph where it does this- around 1000 on 27/09. I just hope that it doesn't do it at the cold end of the curve....
As for the LWT actually being cooler than OAT I hadn't noticed this. Going back to my plotly graph it is only by about 2 degrees C lower so assume this must be where the system water isn't benefiting from solar gain that the climate by the pump would have been, on that day?
Posted by: @bensonthat is so odd. I wonder why mine does this. There's no doubt that mine does this as I've been closely watching it as well over the last couple of days as as soon as we are 16 and above, it will stop heating.
Maybe plot some more variables to see what is really happening. OAT as I said before, and set LWT, plus something that tells you what the heat pump is actually doing, amps in or compressor frequency. To be truly off, both the latter must both be zero.
Posted by: @bensonI just hope that it doesn't do it at the cold end of the curve....
I don't think it will, that really would not make any sense. Unless our Oriental colleagues want us to live interesting times.
Posted by: @bensonGoing back to my plotly graph it is only by about 2 degrees C lower so assume this must be where the system water isn't benefiting from solar gain that the climate by the pump would have been, on that day?
I agree, it is not a lot, but something is cooling that water!
Midea 14kW (for now...) ASHP heating both building and DHW
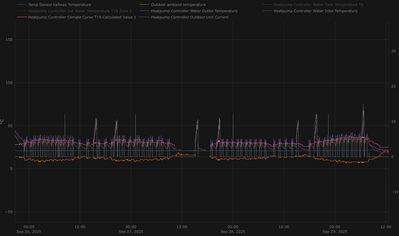
@benson - getting there - you need to put all the variables on the same chart, ie add those from the second chart to the first chart plus the set LWT, for the time period shown in the first chart so you can see what happens when the LWT goes below the OAT. Also add a note (in the post or on the chart) saying what your current WCC end point settings are.
Midea 14kW (for now...) ASHP heating both building and DHW
@cathoderay ...bit cluttered and some missing data for reasons unknown, but here's the graph with everything.
@benson - thanks.
I've said it before, and I'll say it again, from a performance point of view there is only one line on the chart that matters, and that is the IAT. It is the sum and product of all the other variables and influences, and if it is steady and in the right place, then on one level none of the other temperature lines matter one jot. From an efficiency point of view, the only line that matters is amps in, which is directly proportional to energy in. Just about everything we do with heat pumps is aimed at keeping the IAT steady an in the right place, using the minimum necessary number of amps in (and so kWh and so £££) to achieve that.
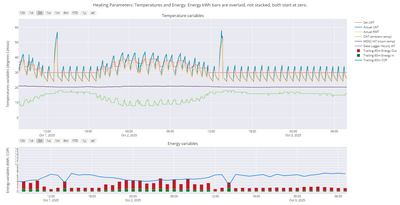
From the performance point of view, your heat pump is doing well - the IAT is steady and where you want it. There may be very minor fluctuations, but they have been effectively lost by using a Y axis with too high a maximum value. From the efficiency point of view, you need a bit more data. You already have the energy in (amps x volts x time = kWh), for energy out you need the LWT/RWT delta t (which you already have), flow rate (which I presume you already have) and specific heat capacity of the circulating fluid (a constant). My python script does these calculations once an hour, thus the values recorded at say 0900 with be the energy in and out, and thereby the COP, for the hour 0800 to 0990, and that is what is behind what you see in the lower part ('Energy variables') of my charts. Behind the scenes, I do have a routine that separates out space heating from DHW heating, using the position of the three port two way diverter valve (SV1, which is in one of the bits at modbus register address 129), but the charted values include both. I do all this in my python scripts, I imagine it could also be done in HA if necessary.
Moving on to the turning off question, yes, your heat pump spends several hours in the off state (zero amps in) in your chart, from about 1200 to 1800 on 27th Sep (but with a DHW spike in the middle), and again 0900 to 1200 on the 29th Sep. But these are notably periods when the OAT was highest, and, I suspect, though some of the data is missing, the set LWT is at or very close to the IAT. At such a state, the heat pump doesn't need to do anything. The building is in effect keeping the circulating water at or close to the set LWT, so the heat pump doesn't come on, or rather, stays off, while in that state.
But above analysis all depends on your WCC settings! What are they???
Midea 14kW (for now...) ASHP heating both building and DHW
@benson OK, i think that is 47 @ -2 for the left hand end, 25 @ 16 degrees for the right hand end.
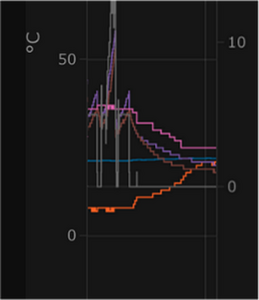
Lets now look at the right hand end of the previous chart, which I have shifted to the left to get it nearer the left hand Y axis (the right Y axis is for the amps in I think):
Now, what I think may be happening is this. The OAT (orange) has got to about 19 degrees, that means the set LWT should be 25 degrees, which it looks like it is (upper pink line). But the actual LWT (mauve line) isn't that far away, at around 20 degrees. Depending on the control logic/hysteresis, that may not be far enough away to trigger the heat pump (compressor) to come on. Somewhere I think we talked about how far the actual LWT needs to deviate from the set LWT to trigger heating on, and i seem to recall is was 5 degrees. If so, with an actual LWT of 20 degrees, kept there by the building being at just above that, then the heat pump will very likely stay off, until the actual LWT deviates enough to trigger the compressor to start up.
The charts would be easier to read with sensible scales, usable grid lines and a better colour scheme! There are loads of guides to selecting effective chart colours online. My charts aren't perfect, but I suggest they are easier to read.
Midea 14kW (for now...) ASHP heating both building and DHW
Posted by: @cathoderayI've said it before, and I'll say it again, from a performance point of view there is only one line on the chart that matters, and that is the IAT. It is the sum and product of all the other variables and influences, and if it is steady and in the right place, then on one level none of the other temperature lines matter one jot. From an efficiency point of view, the only line that matters is amps in, which is directly proportional to energy in. Just about everything we do with heat pumps is aimed at keeping the IAT steady an in the right place, using the minimum necessary number of amps in (and so kWh and so £££) to achieve that."
This is one of the best explanations I have seen on here thanks!
As we are currently being battered by the wind I think today is the day to update my Home Assistant integration one thing that it is struggling to do reliably is to is measure the COP I am not sure why maybe it is because it is using real time data I am not sure.
Posted by: @cathoderayMy python script does these calculations once an hour, thus the values recorded at say 0900 with be the energy in and out, and thereby the COP, for the hour 0800 to 0990, and that is what is behind what you see in the lower part ('Energy variables') of my charts. Behind the scenes, I do have a routine that separates out space heating from DHW heating, using the position of the three port two way diverter valve (SV1, which is in one of the bits at modbus register address 129), but the charted values include both. I do all this in my python scripts, I imagine it could also be done in HA if necessary.
For your COP /Efficiency rating do you do an average for that hour?
Kind Regards
Si
——————————————————————————
Grant Aerona3 13kW
13 x 435w + 13x 480w Solar Panels
Sigenergy 10kW Inverter
16kW Sigenstor battery
Posted by: @cathoderayDepending on the control logic/hysteresis, that may not be far enough away to trigger the heat pump (compressor) to come on. Somewhere I think we talked about how far the actual LWT needs to deviate from the set LWT to trigger heating on, and i seem to recall is was 5 degrees. If so, with an actual LWT of 20 degrees, kept there by the building being at just above that, then the heat pump will very likely stay off, until the actual LWT deviates enough to trigger the compressor to start up.
Are you suggesting the controller is an "on-off" one? Because that would null the inverter capabilities, i.e. smooth, continuous control of the LWT.
Midea MHCV10WD2N7 R290, 5.8kWp energy community solar power.
Posted by: @grantmethestrengthThis is one of the best explanations I have seen on here thanks!
Thank you, that is very kind of you to say so!
Posted by: @grantmethestrengthFor your COP /Efficiency rating do you do an average for that hour?
Yes. I select the last 60 rows of minute data, and take the averages, having previously confirmed this (unsurprisingly, but I like to check things) gives the same result as summing the minute data. The key lines in the code are (note how clean they are compared to HA code!):
# get the last hour's data from the minute data file
df = pandas.read_csv("./modbus/mideadata.csv", skiprows=range(1,lines-60))

# calculate energy in for the last hour in kWh
calc_kWh_in = round(((df.amps_in.mean() * df.volts_in.mean() * 1) / 1000) * dcf, 2)

# calculate energy out for the last hour in kWh
calc_kWh_out = round((df.flowrate.mean()/3.6) * spht * (df.LWT.mean() - df.RWT.mean()), 2)

# calculate the COP for the last hour
calc_60m_COP = round(calc_kWh_out / calc_kWh_in, 2)
The energy in dcf (discrepancy correction factor) value is a constant based on the discrepancy between the calculated values, and my independent kWh energy in meter, which supplies only the heat pump. The value of the constant dcf is 1.18, measured over the long term (months/years). I have never been able to explain what causes it, but suspect it may be other things that use energy inside the heat pump, notably but not exclusively the circulating pump. The calculated value is only the energy going into the compressor. For energy out, the divide by 3.6 converts from Midea's cubic metres per hour to litres per second, and spht is the specific heat capacity of the circulating fluid (4.05, as I have some glycol in the system).
Posted by: @tasosAre you suggesting the controller is an "on-off" one? Because that would null the inverter capabilities, i.e. smooth, continuous control of the LWT.
Look at the charts, both @benson's recent one (with amps in), and the one I posted a while back with the compressor frequency. When they are off, they are off, when they are on they jump around rather a lot. But the actual LWT tends to follow a smooth-ish path most of the time, and most of the steps are probably artefacts because the temps are measured in whole numbers at discrete moments in time.
I think you already know that over most of the OAT range, Midea and Midea clone heat pumps slow cycle to modulate output, with the average of the actual LWT being close to the set LWT. No one outside Midea HQ that I know of knows why they do things this way.
Midea 14kW (for now...) ASHP heating both building and DHW
- 27 Forums
- 2,495 Topics
- 57.8 K Posts
- 299 Online
- 6,220 Members
Join Us!
Worth Watching
Latest Posts
-

RE: Electricity price predictions
@skd I think your guess might well be right - unfortuna...
By Toodles , 4 minutes ago
-
RE: Humidity, or lack thereof... is my heat pump making rooms drier?
@majordennisbloodnok I’m glad I posted this. There see...
By AndrewJ , 15 minutes ago
-
RE: What determines the SOC of a battery?
@batpred I didn't write the Seplos BMS software, I a...
By Bash , 2 hours ago
-
RE: Testing new controls/monitoring for Midea Clone ASHP
@tasos and @cathoderay thanks. I have some history grap...
By benson , 2 hours ago
-

I am having my existing heat pump changed to a Vaillant...
By trebor12345 , 3 hours ago
-
Our Experience installing a heat pump into a Grade 2 Listed stone house
First want to thank everybody who has contributed to th...
By Travellingwave , 3 hours ago
-
RE: Setback savings - fact or fiction?
@cathoderay The input power is largely determined by...
By RobS , 4 hours ago
-

RE: Solis inverters S6-EH1P: pros and cons and battery options
Just to wrap this up here for future readers: The S...
By Batpred , 6 hours ago
-
RE: Struggling to get CoP above 3 with 6 kw Ecodan ASHP
Welcome to the forums.I assume that you're getting the ...
By Sheriff Fatman , 6 hours ago
-
RE: Say hello and introduce yourself
@editor @kev1964-irl This discussion might be best had ...
By GC61 , 7 hours ago
-

@painter26 — as @jamespa says, it's for filling and re-...
By cathodeRay , 11 hours ago
-

RE: Oversized 10.5kW Grant Aerona Heat Pump on Microbore Pipes and Undersized Rads
@uknick TBH if I were taking the floor up ...
By JamesPa , 22 hours ago
-

RE: Getting ready for export with a BESS
I would have not got it if it was that tight
By Batpred , 24 hours ago
-
RE: Need help maximising COP of 3.5kW Valiant Aerotherm heat pump
@judith thanks Judith. Confirmation appreciated. The ...
By DavidB , 1 day ago
-

RE: Recommended home battery inverters + regulatory matters - help requested
That makes sense. I thought better to comment in this t...
By Batpred , 1 day ago
-
Bosch CS5800i 7kW replacing Greenstar Junior 28i
My heat pump journey began a couple of years ago when I...
By Slartibartfast , 1 day ago
-

RE: How to control DHW with Honeywell EvoHome on Trianco ActiveAir 5 kW ASHP
The last photo is defrost for sure (or cooling, but pre...
By JamesPa , 1 day ago
-

RE: Plug and play solar. Thoughts?
Essentially, this just needed legislation. In Germany t...
By Batpred , 1 day ago
-
RE: A Smarter Smart Controller from Homely?
@toodles Intentional opening of any warranty “can of wo...
By Papahuhu , 1 day ago
-
RE: Safety update; RCBOs supplying inverters or storage batteries
Thanks @transparent Thankyou for your advic...
By Bash , 1 day ago
-
RE: Air source heat pump roll call – what heat pump brand and model do you have?
Forum Handle: Odd_LionManufacturer: SamsungModel: Samsu...
By Odd_Lion , 1 day ago
-
RE: Configuring third party dongle for Ecodan local control
Well, it was mentioned before in the early pos...
By F1p , 2 days ago
-

RE: DIY solar upgrade - Considering adding more panels
I know this is a bit old, but it made me wonder what co...
By Batpred , 2 days ago


