Defrost Cycles - How Common Are They?
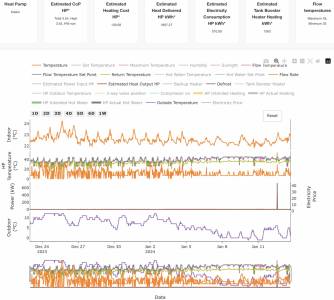
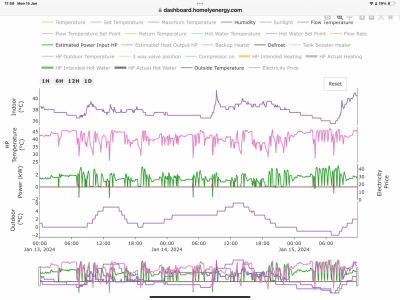
I have rarely noticed any ice build-up on the ASHP vanes and now I have access to the Homely Dashboard Data, I decided to enquire… Since Santa went on his merry way, I have only been outside at the right time to notice one ice up in progress and this was on Friday 12th. January; I have however, occasionally noticed the bottom of a radiator is cool for a few minutes whilst higher up on the same panel is still warm From this, I deduce that there is probably an intermediary stage that can prevent an icing-up. I am attaching a screen grab with a few relevant factors displayed - I note just the one defrost during this period of time. The majority of the time has been with temperatures well above 0 degrees C so perhaps ‘real defrosts’ are only required close to freezing point; I’d be interested to hear from other forum users about their experiences. BTW, the ASHP does not have a built in defrost heating elements so uses the energy in the circulating water only. Regards, Toodles
Toodles, heats his home with cold draughts and cooks food with magnets.
I think you'll find it quite hard to tell based on either poking radiators, or long term data. There are lots of spikes in the "HP temperature" that could be defrosts but too zomed out to tell.
Try going into a 24hr scale it should be a lot more obvious - look for spikes .
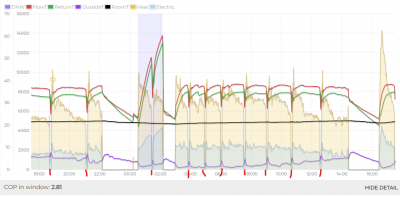
here's mine for the last 24hrs (to 1700 13/1). the defrosts are pretty obvious (but I've marked them for clarity anyway). its +2 here but 95% humidity. thats what matters. that is enough for regular trips to defrost-land.
My octopus signup link https://share.octopus.energy/ebony-deer-230
210m2 house, Samsung 16kw Gen6 ASHP Self installed: Single circulation loop , PWM modulating pump.
My public ASHP stats: https://heatpumpmonitor.org/system/view?id=45
11.9kWp of PV
41kWh of Battery storage (3x Powerwall 2)
2x BEVs
@toodles - interestingly, that plot looks like a plotly/python plot, which is what I use. I don't normally include the top right icons, but I do include the time scale buttons. That suggests to me Homely's code may be written in python.
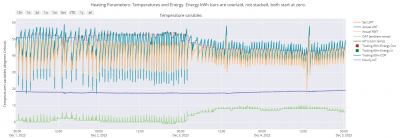
Defrosts, at least on my system, can be identified by the LWT falling below the RWT. Here's an image I posted recently with defrosts on the left, normal cycling on the right, with the big spikes on the right being DHW heating:
As you can see, the defrost cycles in this example are common. On 2nd Dec, there were just over 31 defrosts, more than one an hour.
Looking at your chart, I think they may be three point where the LWT dips below the RWT, on the right hand side, two between 8 and 11th Jan, and one almost on the right hand margin, and if they are dips in the LWT to below the RWT, then my guess is they may be defrosts, and on that basis, not more than one a day if that. They may be other occasions as well, around 2nd Jan, but there shouldn't be defrosts at the prevailing OAT at that time.
It's difficult to see the detail in the clutter, and I think much of the time the Set LWT (mud colour) is overlaid on top of the actual LWT (magenta). Perhaps try zooming in on them (click and drag to select the area of interest, you can zoom vertically as well as horizontally, and then pan left and right after clicking the four headed arrow at top right).
Edit: @iancalderbank beat me to it! You can also the see the signature dips in the LWT, going below the RWT, in his chart.
Midea 14kW (for now...) ASHP heating both building and DHW
@cathoderay Yes, you are spot on, it has Plotly written at the top right just out of screen shot. I am still getting the hang of the facilities offered but have discovered how to turn features on or remove from plots. Will do some more playing when time allows - much ‘fun’ to be had I think! Regards, Toodles.
Toodles, heats his home with cold draughts and cooks food with magnets.
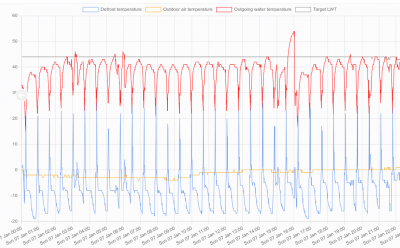
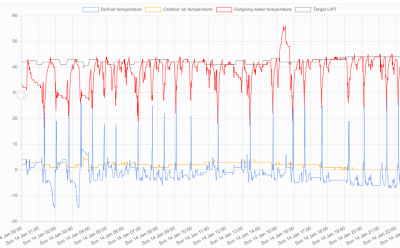
Last Sunday, it was average -1.3C and very damp, so was in "defrost hell" which is every 40ish mins for a Grant:
yesterday, it was +1.3C and dry, so cycles had increased to about 80 mins, although still a few at the shorter duration.
Where the Blue defrost temp goes up; and red power line comes down, is a defrost; outside unit by the lounge window so I can see defrost clouds when they happen 😀
Grant Aerona 3 10kW
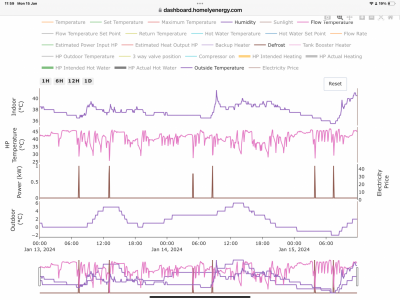
Thank you MikeF1, I have taken new readings this morning that cover the last two days. I’m attaching two graphs showing fewer parameters for clarity. Defrost cycles appear to be few and far between so maybe something else is going on; I note the flow temperature drops at the defrost dips as one would expect. I doubt that our air is less humid than elsewhere, we are only a mile or just over from the River Thames bank! I have included estimate of power use, humidity, defrost and flow temperature. Drops in flow temperature coincide with defrost times, but is this the full answer? Regards, Toodles.
Toodles, heats his home with cold draughts and cooks food with magnets.
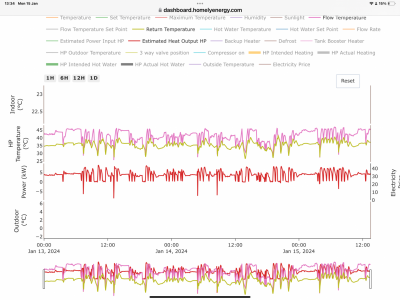
@toodles I would really expect there to be regular defrosts with the conditions we have right now. can you graph "Flow Temperature" and "Return Temperature" and "Estimated HP power output"
during a defrost you will see Return temperature exceed Flow temperature, and HP power output (in terms of heat energy) will go negative.
The graphs you have show "HP temperature" which is unclear (at least to me) what it refers to.
My octopus signup link https://share.octopus.energy/ebony-deer-230
210m2 house, Samsung 16kw Gen6 ASHP Self installed: Single circulation loop , PWM modulating pump.
My public ASHP stats: https://heatpumpmonitor.org/system/view?id=45
11.9kWp of PV
41kWh of Battery storage (3x Powerwall 2)
2x BEVs
@iancalderbank Hello Ian, here is the graph with those three parameters only displayed. As you say, the heat pump power output does go down to -5 at some points. Regards, Toodles.
Toodles, heats his home with cold draughts and cooks food with magnets.
@toodles hmm still a bit hard to see to be honest. there are periods where the WT's drop right down but the output doesn't go negative, which is puzzling as they could well be defrosts.
I've really noticed how much difference humidity makes to performance now we're into a cold dry period. On mine, today, 0C and 67% humid (according to met office), 6hrs between defrosts. saturday, 3C and much higher humidity , 1.5 - 2 hrs between defrosts. overall COP on both days quite similar. I'm going to have to get something to record relative humidity properly!
My octopus signup link https://share.octopus.energy/ebony-deer-230
210m2 house, Samsung 16kw Gen6 ASHP Self installed: Single circulation loop , PWM modulating pump.
My public ASHP stats: https://heatpumpmonitor.org/system/view?id=45
11.9kWp of PV
41kWh of Battery storage (3x Powerwall 2)
2x BEVs
- Thereby hangs another curlywurly furry tail I feel; I have Govee thermometers in each room and although I would expect the bathroom one to indicate a higher humidity level than others, there is still a considerable difference from room to room - perhaps outside in the open-air, levels are more stable. The graphs are from the Homely Dashboard; as I understand it, this has been added to the installer’s aids by HomelyEnergy as a response to installer’s requests but is really a Beta Product at this stage so may improve in due course - helpful for all that though! Regards, Toodles.
Toodles, heats his home with cold draughts and cooks food with magnets.
Posted by: @iancalderbank@toodles hmm still a bit hard to see to be honest. there are periods where the WT's drop right down but the output doesn't go negative, which is puzzling as they could well be defrosts.
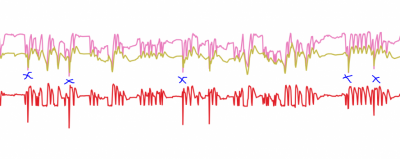
I think they are there. I have marked them with blue crosses:
The key mark of a defrost is the LWT (flow temp) falls below the RWT (return temp). The magenta line can just be seen coming out below the drab olive line, and as it happen the output also drops, but I would be less inclined to use that as a marker, as it will depend on how they calculate heat out. Water temp (LWT and RWT) is a much simpler thing to measure.
Midea 14kW (for now...) ASHP heating both building and DHW
A lot of the cheap humidity sensors are +- 5% accuracy. If you want better agreement between rooms that you think should be close to each other you need a Sensirion sensor.
It is possible to check the accuracy of pH sensors, although it might be impracticable with large wall units:
- 27 Forums
- 2,495 Topics
- 57.8 K Posts
- 301 Online
- 6,220 Members
Join Us!
Worth Watching
Latest Posts
-

RE: Electricity price predictions
I am always impressed with how you keep abreast of so m...
By Batpred , 2 minutes ago
-

RE: Setback savings - fact or fiction?
I fully understand your reasoning, same steady inputs s...
By cathodeRay , 11 minutes ago
-
RE: Humidity, or lack thereof... is my heat pump making rooms drier?
@majordennisbloodnok I’m glad I posted this. There see...
By AndrewJ , 33 minutes ago
-
RE: What determines the SOC of a battery?
@batpred I didn't write the Seplos BMS software, I a...
By Bash , 2 hours ago
-
RE: Testing new controls/monitoring for Midea Clone ASHP
@tasos and @cathoderay thanks. I have some history grap...
By benson , 2 hours ago
-

I am having my existing heat pump changed to a Vaillant...
By trebor12345 , 3 hours ago
-
Our Experience installing a heat pump into a Grade 2 Listed stone house
First want to thank everybody who has contributed to th...
By Travellingwave , 3 hours ago
-

RE: Solis inverters S6-EH1P: pros and cons and battery options
Just to wrap this up here for future readers: The S...
By Batpred , 6 hours ago
-
RE: Struggling to get CoP above 3 with 6 kw Ecodan ASHP
Welcome to the forums.I assume that you're getting the ...
By Sheriff Fatman , 6 hours ago
-
RE: Say hello and introduce yourself
@editor @kev1964-irl This discussion might be best had ...
By GC61 , 8 hours ago
-

@painter26 — as @jamespa says, it's for filling and re-...
By cathodeRay , 11 hours ago
-

RE: Oversized 10.5kW Grant Aerona Heat Pump on Microbore Pipes and Undersized Rads
@uknick TBH if I were taking the floor up ...
By JamesPa , 22 hours ago
-

RE: Getting ready for export with a BESS
I would have not got it if it was that tight
By Batpred , 24 hours ago
-
RE: Need help maximising COP of 3.5kW Valiant Aerotherm heat pump
@judith thanks Judith. Confirmation appreciated. The ...
By DavidB , 1 day ago
-

RE: Recommended home battery inverters + regulatory matters - help requested
That makes sense. I thought better to comment in this t...
By Batpred , 1 day ago
-
Bosch CS5800i 7kW replacing Greenstar Junior 28i
My heat pump journey began a couple of years ago when I...
By Slartibartfast , 1 day ago
-

RE: How to control DHW with Honeywell EvoHome on Trianco ActiveAir 5 kW ASHP
The last photo is defrost for sure (or cooling, but pre...
By JamesPa , 1 day ago
-

RE: Plug and play solar. Thoughts?
Essentially, this just needed legislation. In Germany t...
By Batpred , 1 day ago
-
RE: A Smarter Smart Controller from Homely?
@toodles Intentional opening of any warranty “can of wo...
By Papahuhu , 1 day ago
-
RE: Safety update; RCBOs supplying inverters or storage batteries
Thanks @transparent Thankyou for your advic...
By Bash , 1 day ago
-
RE: Air source heat pump roll call – what heat pump brand and model do you have?
Forum Handle: Odd_LionManufacturer: SamsungModel: Samsu...
By Odd_Lion , 1 day ago
-
RE: Configuring third party dongle for Ecodan local control
Well, it was mentioned before in the early pos...
By F1p , 2 days ago
-

RE: DIY solar upgrade - Considering adding more panels
I know this is a bit old, but it made me wonder what co...
By Batpred , 2 days ago

