@cashback - impressive work. Time will tell whether you end up with a warm feeling on the inside or a red face on the outside ;-).
One thing I am pretty sure I have established (because of the read-write-read-write-read tests I did) is that you can using simple python minimalmodbus code set the upper and lower LWT on the weather comp curve. This means you have direct real time control of the LWT,which has great potential. This goes beyond your four current controls which I think are all in effect toggles/switches, as opposed to something that can set (write) a value. Might be worth seeing if you can add that capability.
Midea 14kW (for now...) ASHP heating both building and DHW
Posted by: @cathoderayyou can using simple python minimalmodbus code set the upper and lower LWT on the weather comp curve. This means you have direct real time control of the LWT,which has great potential. This goes beyond your four current controls which I think are all in effect toggles/switches, as opposed to something that can set (write) a value. Might be worth seeing if you can add that capability.
Indeed, I have experimented with this, however the Node-RED Home Assistant integration doesn't have the capability to add number inputs as controls, only toggle switches (hence why I am minded to go down the full blown client library and proper integration route).
I did create something that will bridge Home Assistant inputs to modbus via Node-RED but it's not very portable at all, hence not sharing here.
Posted by: @cashbackHas anyone made sense of the TF Module Temperature ("Feedback on outdoor unit, unit: °C") on address 135?
Perhaps try plotting the TF Module Temperature over time, and with other variables, to see if any pattern emerges? Also worth having a look at the manuals, to see if the 'TF Module' (more Midea mumbo jumbo) is defined anywhere. Most Midea temps are T followed by a number, so it may be that TF is the odd one out. If its units are degrees C, then presumably it is a temperature, but of what?
Midea 14kW (for now...) ASHP heating both building and DHW
The Modbus register 135 module temperature feedback is not marked as a measured value, probably calculated. It is displayed in operating parameters 9/9. The hydraulic or heat exchanger is referred to as a module. It could also mean the monoblock completely.
Found this some days ago for midea clones https://github.com/marekorok/modbus-midea/blob/main/modbus-esp8266.yaml. But can't judge, ordered such a small calculator esp8266 for a test.
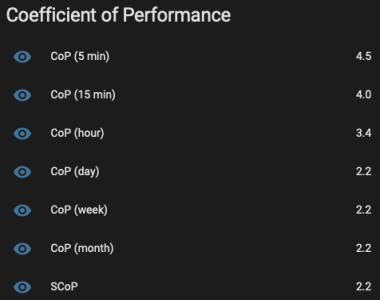
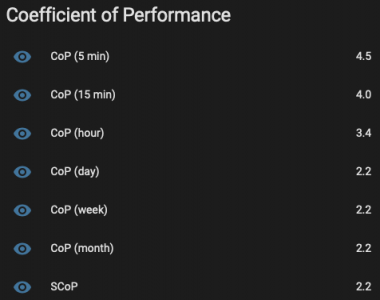
I have Home Assistant calculating CoP over a few intervals now.
This is using power consumption from the Shelly, and a trapezoidal Riemann Sum of the heat output (as reported via Modbus). The figures for 1 day and longer are skewed because the electrical power meter is a few hours older than the heat meter.
I elected to use the Shelly over the energy in reported from modbus because of the imprecision, and also because the energy spent on the ancillaries (like the pump and heating controls) should be fairly constant, and also counts towards energy required to heat my home.
Posted by: @gormFound this some days ago for midea clones
Thanks, but link goes to 404 - any possibility you could re-post a correct link?
@cashback - this interestingly shows what I have suspected, longer intervals produce more credible COPs (though your much longer intervals may strain credibility the other way!). I am still collecting data, and will soon, see how my hourly COPs compare to my daily COPs. If some of the errors are random, then on a short time frame they may skew the results, but cancel out over longer time frames.
Posted by: @cashbackThe figures for 1 day and longer are skewed because the electrical power meter is a few hours older than the heat meter.
I'm not sure how this happens: if you are doing the COP calculation on data covering the interval, whatever it is, and the data is complete for the interval, then the fact a meter is 'older' than another one shouldn't make any difference.
Midea 14kW (for now...) ASHP heating both building and DHW
Posted by: @cashbackThe figures for 1 day and longer are skewed because the electrical power meter is a few hours older than the heat meter.
I'm not sure how this happens: if you are doing the COP calculation on data covering the interval, whatever it is, and the data is complete for the interval, then the fact a meter is 'older' than another one shouldn't make any difference.
It's down to how the Home Assistant Statistics sensors are configured - they're measuring the change between two points, the meter sensors are less than 1 day old, so the oldest readings on the heat and energy meters are different right now because, as you pointed out, the data must be complete for them to be representative. Once the data is older than 1 day/week/month/year then each of those sensors will become representative.
To your first point:
Posted by: @cathoderaythis interestingly shows what I have suspected, longer intervals produce more credible COPs (though your much longer intervals may strain credibility the other way!)
For the shorter ones (5 and 15 minutes, and to some extent, one hour) it all depends where in the cycle you are at that point in time. At the start of the cycle, the CoP is < 1. Mid/end-cycle, short term CoP is at its greatest. When you're spanning the end of the cycle, the short term CoP is ridiculous high (next to no power going in, but the emitters still have heat to give off from the circulating water). The short term ones are useful for seeing how CoP changes over the course of a day, or the peak CoP mid-cycle.
Ask me in a year what the SCoP looks like!
Posted by: @cashbackIt's down to how the Home Assistant Statistics sensors are configured - they're measuring the change between two points, the meter sensors are less than 1 day old, so the oldest readings on the heat and energy meters are different right now because, as you pointed out, the data must be complete for them to be representative. Once the data is older than 1 day/week/month/year then each of those sensors will become representative.
Yes, that all makes sense, it was how I had HA calculate kWh and COPs using statistics and templates. For example, to calculate the 24 hour trailing COP based on total energy in/out I had in configuration.yaml:
sensor:
  - platform: statistics
    name: "kWh used in last 24 hours"
    entity_id: sensor.device_id_total_energy_consumption
    state_characteristic: change
    max_age:
      hours: 24

  - platform: statistics
    name: "kWh produced in last 24 hours"
    entity_id: sensor.device_id_total_produced_energy
    state_characteristic: change
    max_age:
      hours: 24


template:
  - sensor:
      - name: "Trailing 24h COP"
        unique_id: my_trailing_24h_cop
        unit_of_measurement: "COP"
        state_class: measurement
        state: >
          {%set used = states('sensor.kwh_used_in_last_24_hours') %}
          {%set produced = states('sensor.kwh_produced_in_last_24_hours') %}
          {{ ((int(produced)/int(used)) | string )[0:4] }}
If I remember correctly, you have to add the state_class: measurement line to the template sensor to get HA to log the values to the statistics table in the database - not exactly intuitive. Compare the above to the HA free python code I am currently using. After loading (I use pandas) the last 60 lines of mideadata.csv (the minute data file), all I need is:
    midea_kWh_in = df.energy_in.max() - df.energy_in.min()

    midea_kWh_out = df.energy_out.max() - df.energy_out.min()

    ## deal with zero energy in
    midea_60m_COP = 0
    if midea_kWh_in > 0:
        midea_60m_COP = round(midea_kWh_out / midea_kWh_in, 2)
Not only is this much shorter, it is also much more human readable: compare the code used in each method to do the actual COP calculation, or the convoluted HA voodoo needed to get a sensibly rounded result with the much clearer basic python round(number, decimal places). In the code, df in the data frame holding the 60 lines of data in orderly rows (minutes x 60) and columns (the parameters, with a header row at the top), such that df.energy_in.max() is the max value in the energy_in column etc. The first two lines of code subtract the minimum value from the maximum value (note no need to specify row) to get the hour's usage, the last line of code calculates the COP, with a zero/if preamble to deal with the zero energy in case (to avoid divide by zero errors). The data then gets written to the hourly data csv file. Being a csv file, it is both robust and extremely easy to read and indeed write to without getting tangled up in the spider's web of a relational database.
Writing my own code also means I can implement a simple way of allocating the energy in/out and so COP to space or DHW heating. By getting (via modbus) the position of the three way diverter valve, I know for each minute which mode the unit is running in. For each mode, have a column in which 0 means not running in that mode, and 1 means running in that mode, and then multiply the energy/COP values by those column values. If 0, the value becomes 0, if 1, the full value gets allocated. Over short time frames, there are, as you mentioned, over-run problems eg immediately after a DHW heating spell in mild weather the space heating LWT is ridiculously high, making the calculated energy out and so COP ridiculously high. I am still working on ways to deal with this (possibly a time offset, ie for each energy out value, divided by the energy in value from two minutes ago). Our current calculations assume instant transfer of the energy in to energy out, which of course is not what happens in real life, there is a lag.
I'm going to set up the code to record 24 hour (daily) values today, and in a few days time will be able to compare the daily values with the hourly values. I'm hoping they will turn out to be much smoother and generally saner.
I know I do bang on about this, but my code is much simpler and much more accessible to beginners, and that is why I continue to plug it rather than HA.
Midea 14kW (for now...) ASHP heating both building and DHW
@gorm - thanks very much for posting the link. Following it, I see it needs 462 lines of not easy to read or maintain code to access a Midea clone over modbus. I think you already know what I am going to say: it is too complicated!
Midea 14kW (for now...) ASHP heating both building and DHW
May be, but also be the author know what he down. I dont know so much about this.
We will see, I looked in Visual Studio. There are about 3600 lines.
- 27 Forums
- 2,495 Topics
- 57.8 K Posts
- 263 Online
- 6,220 Members
Join Us!
Worth Watching
Latest Posts
-
Call for heat on open loop weather comp system
Hi all, is there anyone familiar with how the Grant R29...
By Patrick , 2 minutes ago
-
RE: Struggling to get CoP above 3 with 6 kw Ecodan ASHP
And a picture of cylinder and surrounding pipe work wou...
By Travellingwave , 11 minutes ago
-

RE: What determines the SOC of a battery?
Sorry should have said the BMS is not Seplos but Pace w...
By Jancold , 20 minutes ago
-

RE: Rate the quality of your heat pump design and installation
When TrustPilot accepted an appeal from a product manuf...
By Batpred , 24 minutes ago
-
RE: Testing new controls/monitoring for Midea Clone ASHP
Please excuse my persistence, but I am struggling to un...
By Tasos , 26 minutes ago
-

@painter26 — good idea. Please do let us know what he s...
By cathodeRay , 44 minutes ago
-

RE: Setback savings - fact or fiction?
@robs — thank you for your as ever valuable comments. T...
By cathodeRay , 2 hours ago
-

RE: Our Experience installing a heat pump into a Grade 2 Listed stone house
I beg to differ. I really could not make any useful pre...
By cathodeRay , 3 hours ago
-
RE: A Smarter Smart Controller from Homely?
@toodles It was the colour that threw me, yours was yel...
By Papahuhu , 3 hours ago
-

RE: Electricity price predictions
Yes, below are the projected figures from just three ye...
By Batpred , 3 hours ago
-

RE: Solis inverters S6-EH1P: pros and cons and battery options
Yes, but I need to reopen the battery box.. I just noti...
By Batpred , 5 hours ago
-

RE: The Hidden Secret to a Successful Heat Pump: Pipe Size Matters
If your heat loss is only 4kW and the pipes leaving the...
By JamesPa , 10 hours ago
-
RE: Humidity, or lack thereof... is my heat pump making rooms drier?
My 2 bed mid-terrace definitely dropped consistently af...
By RadWhisperer , 13 hours ago
-

RE: Say hello and introduce yourself
You can send private messages via the Messages (envelop...
By cathodeRay , 1 day ago
-
RE: Peak Energy Products V therm 16kW unit heat pump not reaching flow temperature
With complete radio silence from Peak and no sign of th...
By DaveC , 1 day ago
-

I understand now what you were referring to. This look...
By trebor12345 , 1 day ago
-

No you arent, because you dont need any, and furthermor...
By JamesPa , 1 day ago
-

RE: Oversized 10.5kW Grant Aerona Heat Pump on Microbore Pipes and Undersized Rads
As I mentioned earlier most radiators have a power outp...
By JamesPa , 1 day ago
-

RE: Getting ready for export with a BESS
I would have not got it if it was that tight
By Batpred , 3 days ago
-
RE: Need help maximising COP of 3.5kW Valiant Aerotherm heat pump
@judith thanks Judith. Confirmation appreciated. The ...
By DavidB , 3 days ago
-

RE: Recommended home battery inverters + regulatory matters - help requested
That makes sense. I thought better to comment in this t...
By Batpred , 3 days ago
-
Bosch CS5800i 7kW replacing Greenstar Junior 28i
My heat pump journey began a couple of years ago when I...
By Slartibartfast , 3 days ago
-

RE: How to control DHW with Honeywell EvoHome on Trianco ActiveAir 5 kW ASHP
The last photo is defrost for sure (or cooling, but pre...
By JamesPa , 3 days ago


