I covered the energy flows, with the numbers, in great detail in https://renewableheatinghub.co.uk/forums/postid/56298/ . The energy used by the defrost (and the energy not delivered to the house during the defrost, etc.) was accounted for in the post-defrost recovery period, based on the IAT having remained constant and conservation of energy being preserved.
Rob I posted this question in full knowledge of your energy flows summary with 11 minute data charts. I was asking for more information. The problem I am seeing is that there are assumptions you have made to allow you to make conclusions like “saving energy” when the data periods are not entirely correct. The defrost period and reset period does use less energy but it must be repaid later.
I haven't made any claims of saving energy, @cathoderay has so maybe you are confusing the two of us? My analysis showed that a small additional amount of energy (electricity) was used.
"... when the data periods are not entirely correct" please describe what you think is not correct with the data periods?
My analysis showed that the energy extracted from the water and the energy not provided to the house during the defrost was repaid during the reheat, it also showed that the energy saved during the defrost was more that used during the reheat.
The second point is you claim the IAT remained constant. Yet this is a very short period before the thermal ramp up post-defrost… any property with reasonable thermal construction would not show a thermal drop with the granular sensitivity of the Mitsubishi thermostat.
The second image in my post shows the IAT remaining constant over a 9+ hour period and 5 defrosts. So any deviations are less that 0.5C over a 9 hour period, in what way do you consider that not good enough to consider the IAT constant for the purposes of analysing one defrost? I've reposted the image below:
The compressed refrigerant between the compressor and the 4-way valve will now go directly to the evaporator coils (thus starting the defrost process) and the refrigerant between the 4-way valve and the PEX will flow back to the compressor (from where it will flow on to the evaporator coils). So the energy won't be wasted.
This second question I posted was to raise the question that data-only reviews like the one you posted do not give any understanding of how a defrost works chemically and what’s happening to the heat exchangers. The reality is that the evaporator becomes a condenser and that affects energy loss which you haven’t accounted for in this. I realise you state you don’t need to know this but it does inform the full picture of what energy is needed to complete the defrost and defrost reset.
The other q
A data-only review sticks to what is provably happening, rather than what is presumed to be happening. The energy lost to the atmosphere is the energy (heat) extracted from the water and the energy (electricity) used by the heat pump during the defrost - both of which were included in my analysis. The mechanism through which this energy is lost to the atmosphere, while interesting, doesn't change its magnitude (which can be no more than the input energy, heat and electricity, during the defrost) and hence its effect on the energy flows of the system.
Given that the chart was created by the OEM guys and they are scientific/engineering/analysis types, it is unlikely it was created just because it could be. Equally you can't infer that just because you don't know of a good reason for the chart that none exists.
It seems we are destined to debate this one forever! Some of the meaningless just-because-I-could charts I have seen have been produced by medical types, who dare I say it are not generally dim types, but then again they aren't always the most numerate of types. I do of course agree that simply because I, a retired medical type, cannot see a good reason doesn't mean there wasn't one.
Looking forward to your data and plots. I can imagine that when considering temperature profile the number of matches will be reduced considerably. Are you also considering solar gain and wind chill effects in you matched pairs?
So am I! The data collection is inevitably slow, it takes a month to get a month's data. Without matching, overnight setbacks appear to use less energy at lower OATs, but the data I have used so far compared (a) random periods of setback in the 2023/24 heating season and (b) spring setback running with autumn no setback running for 2025, and spring is not autumn, even if at times the OATs are similar.
You are right, matching even just on mean daily OAT does considerably reduce the sample sizes. Matching on mean daily OAT and visual appearance of the OAT profile reduces the samples to only a handful. I'm hoping that once I have more data, I will have more matches, which seems a not unreasonable supposition.
I have also considered how to match on solar gain and wind chill (I think it was @jamespa or maybe the Major who also brought this up a while back), and it should be possible using weather reports, but doing so will reduce sample size again. The other option is some sort of mega-regression analysis, ie adjust for the variables, which would mean I could use larger sample sizes, rather than use matching which is in its way a form of stratification that controls for the variables by matching. The advantage of using matched pairs is that as a method it is more transparent, the moment I start using complex regression I feel I am entering black box territory. Furthermore, in an echo of the just-because-I-can charts discussion, just because I can do a complex regression analysis doesn't mean I should do one! But people do it all the time in medical research! It's called data fishing, you just carry on doing analysis after analysis until something pops up, and almost always it is bad practice.
Midea 14kW (for now...) ASHP heating both building and DHW
You are right, matching even just on mean daily OAT does considerably reduce the sample size...
Quite.
There is a significant part of me that says, if an effect is so small that it takes this much effort to dig it out of the noise in the data, then it's too small to be worth spending time on unless it's life threatening!
4kW peak of solar PV since 2011; EV and a 1930s house which has been partially renovated to improve its efficiency. 7kW Vaillant heat pump.
There is a significant part of me that says, if an effect is so small that it takes this much effort to dig it out of the noise in the data, then it's too small to be worth spending time on unless it's life threatening!
What has happened to your spirit of scientific enquiry! As long as there is a specific question, which there is, then the journey to answer it may even be more interesting than the destination.
Midea 14kW (for now...) ASHP heating both building and DHW
What has happened to your spirit of scientific enquiry! As long as there is a specific question, which there is, then the journey to answer it may even be more interesting than the destination.
That is true of course, but when there are multiple questions to be answered and only limited time to answer them, choices have to be made.
As it happens the question in the title does interest me but I'm put off by a growing conviction that the answer is rather too dependent on circumstance for it to be particularly useful, and that other factors dominate in many practical cases!
4kW peak of solar PV since 2011; EV and a 1930s house which has been partially renovated to improve its efficiency. 7kW Vaillant heat pump.
I haven't made any claims of saving energy, @cathoderay has so maybe you are confusing the two of us? My analysis showed that a small additional amount of energy (electricity) was used
I will reply to your other comments later but just to answer your first point…. In your summary did you not say:
“But the system saved 0.164 - 0.034 = 0.13 kWh of electricity when compared to pre-defrost. The total heat to replace is 0.691 + 0.256 = 0.947 kWh. I've been quite conservative here”
this was just after chart4. And then again just after Chart 5 (Post defrost no 1…..11mins)
“That's 0.197 - 0.164 = 0.033 kWh more than pre-defrost (0.13 - 0.033 = 0.097 kWh remaining from the defrost period saving).”
Also in another comment you made directly to me…
“But as already mentioned, the energy in (electricity) to achieve this is approximately the same as the energy saved during the defrost (as the compressor isn't using as much electricity during the defrost)”
Im not, as you put it confused… Those are not the words of @cathoderay. However this is about cultivating an impression of savings being made by repeating the words.
Energy isn’t “saved” by switching the compressor off for 20 % of the time (12 mins defrost+reset out of 60 minutes or 99 minutes operation) The energy needs to be made up…. Otherwise we would all be switching off heat pumps 20% of the time.
The reality of the situation is that off-time (particularly for a defrost) needs to be made up by raising the flow temperature quickly to counter the cold slug in the return flow, for the other 80% of the time. The ramp up after the defrost would appear to be typically 50 minutes long and the flow temperature modulates down but is left higher by a few degrees than the steady state flow temperature. As already stated this means the weather curve setting can easily take over the final flow temperature and hide the real energy needed for recovery. (This is based on the more common 60 minute defrost cycle not the 99 minute cycle you had chosen)
sentence added later…
this chart you posted conveniently shows the rapid ramp up which takes place after each defrost. Reason possibly being the system doesn’t know yet when the next defrost is going to be needed.
This post was modified 5 days ago 3 times by SUNandAIR
I will reply to your other comments later but just to answer your first point….In your summary did you not say: “But the system saved 0.164 - 0.034 = 0.13 kWh of electricity when compared to pre-defrost. The total heat to replace is 0.691 + 0.256 = 0.947 kWh. I've been quite conservative here” this was just after chart4. And then again just after Chart 5 (Post defrost no 1…..11mins) “That's 0.197 - 0.164 = 0.033 kWh more than pre-defrost (0.13 - 0.033 = 0.097 kWh remaining from the defrost period saving).”
In the context of the described time periods yes but not the conclusion of the analysis, which is more important. During the defrost less electricity energy is used when compared to constant running - hence saved comparatively and temporarily. This amount of saved energy is then more than used up in the post defrost reheat.
“But as already mentioned, the energy in (electricity) to achieve this is approximately the same as the energy saved during the defrost (as the compressor isn't using as much electricity during the defrost)”
As above, the compressor isn't using as much electricity during the defrost and so compared to constant running input electrical energy is saved. But as my analysis shows the reheat ultimately uses a more electrical energy than was saved during the defrost.
Im not, as you put it confused… Those are not the words of @cathoderay. However this is about cultivating an impression of savings being made by repeating the words.
You seem to be either unable or unwilling to understand my analysis. Maybe because it challenges your view of how a defrost and the subsequent reheat work, but the numbers recorded and engineering (of the sensors/monitoring) don't lie. Your understanding of how a defrost works seems to be from using MelCloud, which I'm familiar with as I also have a Mitsubishi heat pump, but it only records data once per minute (so records relatively few data points during a defrost), its temperature sensors are only accurate to 0.5C and its electrical power consumption is just an estimate, so there are some severe limitations to using MelCloud data.
Energy isn’t “saved” by switching the compressor off for 20 % of the time (12 mins defrost+reset out of 60 minutes or 99 minutes operation) The energy needs to be made up…. Otherwise we would all be switching off heat pumps 20% of the time.
If energy is saved when a heat pump is not running (e.g. during a set back) is the entire point of this thread! I'm glad you are so sure that no energy is saved.
The ramp up after the defrost would appear to be typically 50 minutes long and the flow temperature modulates down but is left higher by a few degrees than the steady state flow temperature. As already stated this means the weather curve setting can easily take over the final flow temperature and hide the real energy needed for recovery. (This is based on the more common 60 minute defrost cycle not the 99 minute cycle you had chosen)
The flow temperature is left slightly elevated due to thermal lag/inertia (I mentioned this in my analysis), it's not higher due to the WC curve as that is lower than the flow temperature. The flow temperature over shoots the target during the reheat. Where did this "common" 60 mins defrosts cycle come from? The defrost cycles from our and others on heatpumpmonitor.org I've looked at vary widely, some are as short as 30 mins while other defrosts occur so infrequently that steady state continuous running resumes between them.
this chart you posted conveniently shows the rapid ramp up which takes place after each defrost. Reason possibly being the system doesn’t know yet when the next defrost is going to be needed.
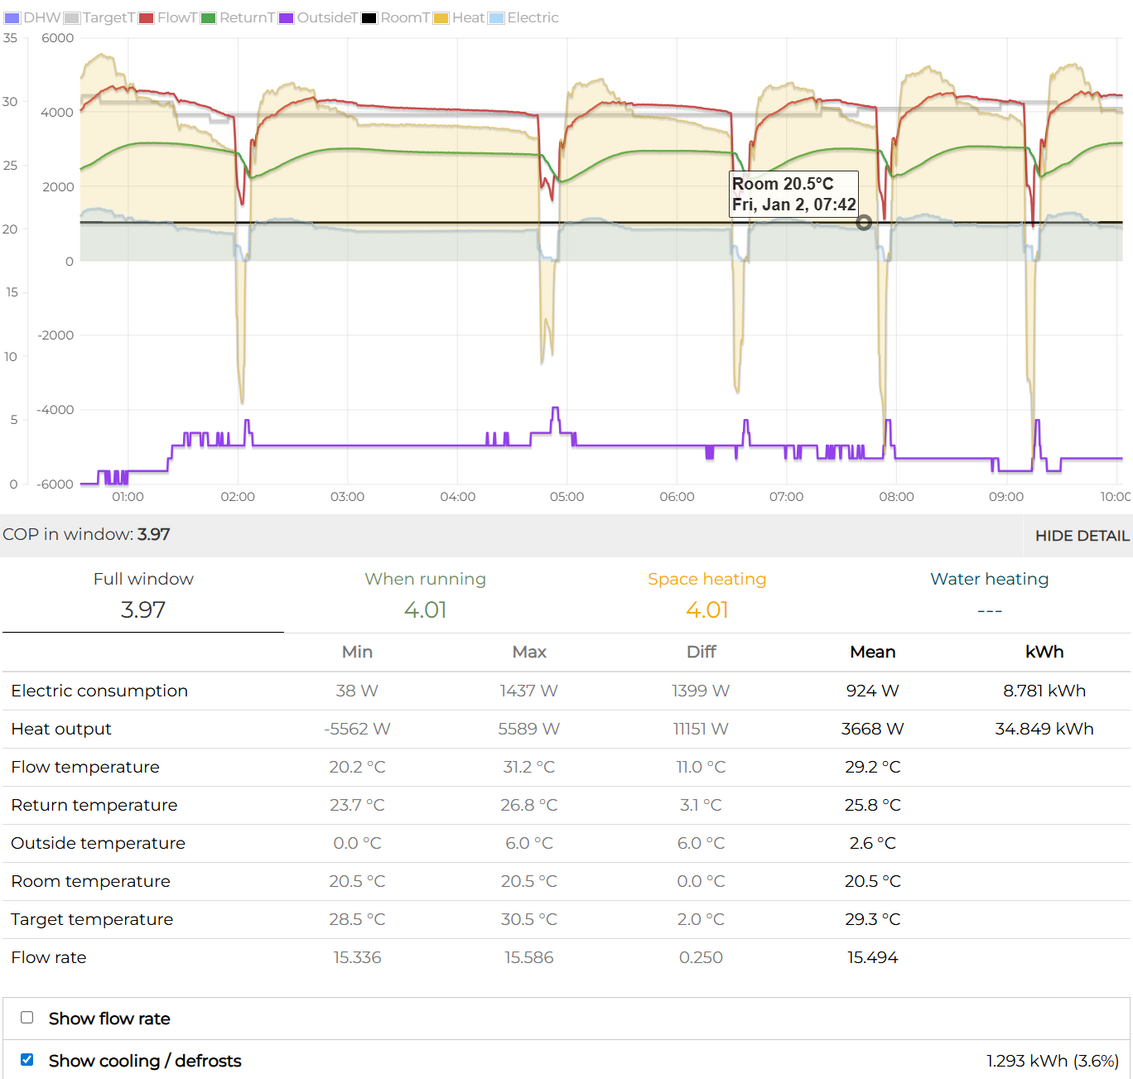
The "rapid ramp up" is just the heat pump resuming normal operation to return the flow to the set temperature, the input power ramps up to 1-1.5kW much like any other restart. For example, here's a non-defrost restart at 6C, as you can see the input power ramps up to a very similar 1-1.5kW:
For example, here's a non-defrost restart at 6C, as you can see the input power ramps up to a very similar 1-1.5kW:
It looks to me as though something is not right about that chart, chiefly not a typical defrost pattern, COP is also alarmingly high for a defrost. Can you perhaps link to or otherwise identify which heatpumpmonitor.org record it comes from? It also fails to say what the X axis units are (but since it is done by engineering types for engineering types who always know what they are doing, perhaps they just intuitively know what the units are anyway). I'd also like to do my AUC pixel counting, on the face of it the recovery uses less extra energy in than the off period saves.
Lots of edits because I can't seem to type today!
This post was modified 4 days ago 3 times by cathodeRay
Midea 14kW (for now...) ASHP heating both building and DHW
For example, here's a non-defrost restart at 6C, as you can see the input power ramps up to a very similar 1-1.5kW:
It looks to me as though something is not right about that chart, chiefly not a typical defrost pattern, COP is also alarmingly high for a defrost. Can you perhaps link to or otherwise identify which heatpumpmonitor.org record it comes from? It also fails to say what the X axis units are (but since it is done by engineering types for engineering types who always know what they are doing, perhaps they just intuitively know what the units are anyway). I'd also like to do my AUC pixel counting, on the face of it the recovery uses less extra energy in than the off period saves.
As I wrote above, it's a "non-defrost restart", so it won't look like a typical defrost.
The peak flow temp is only 28.5C and the COP is entirely normal for our heat pump. The cycling isn't normal but because the "thermostat" is turned down at the moment.
The X axis is time (06:00, 07:00 etc) or did you mean the Y axis that has two scales so that temperature and power can be charted together?
As I wrote above, it's a "non-defrost restart", so it won't look like a typical defrost.
Sorry, my fault, I only saw defrost, not its prefix. A 'normal' cycling stop and start then, and happening because your 'thermostat' (room stat?) is turned down?
The 'COP in window' is still impressively (suspiciously?) high for an OAT of 6°C. It is also as you say a very low peak flow temp given the OAT. Can you throw some light on how you achieve that? UFH?
I wonder if the off period somehow contributes to high COP, all the more so as the 'window' includes part of another off period, without its recovery period.
Here are the areas for the 'non-defrost' cycle shown above, area 1 is energy saved during off, area 2 is extra energy used during recovery, given a baseline as shown, based on the steady state OAT (6°C) and energy in between 09:00 and 10:00:
I am probably just being thick again, but it seems to me 1286 is a considerably smaller number than 3500. Overall, that 'non-defrost' setback appears to have used considerably less energy than would have been used if the setback had not happened.
Midea 14kW (for now...) ASHP heating both building and DHW