Best temperature wave form for best economy and efficiency .
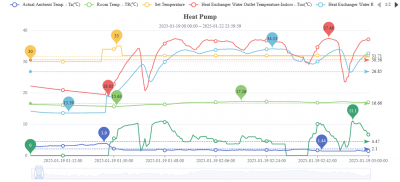
Posted by: @ivanhoewSampling rate is every 30 seconds ray , if i zoom in i can see that rate .
i probably have not explained myself vey well , i have been using weather compensation all the time , i am just using a fixed weather state to try to compare eff.
yes the data can be downlaoded to excel , i am hoping to use this to calulatec my cop .
All that is good news, and I now understand what you are trying to do.
I did try something similar, fixed flow temp instead of WC, not long after I had my heat pump installed. It turned out to be more expensive, at least on a Mk 1 Eyeball assessment.
You may know how to calculate energy in and energy out to calculate COP, if not, for each hour (this is a 60min trailing COP)
energy in over the hour in kWh = (mean amps over the hour x mean volts over the hour (or 240 if you don't have volts data)) / 1000
mean amps = sum for the hour, then divide by number of readings (120 if every 30s), ditto for volts
Energy out is a bit more complicated:
basic formula is energy out over the hour in kWh = mean flow rate x (mean LWT - mean RWT) x specific heat capacity of circulating fluid (4.2 for water, adjust down if you have glycol)
note the importance of 'over the hour' - strictly speaking this is power (kW) but because it is over an hour, it is also energy (kWh)
watch out for units, especially flow rate, above formula is for flow rate in litres/sec, adjust as necessary if you have different units
I do all this in python scripts and then log it in csv files. You can probably set up a spreadsheet with a couple of formulas an hour apart, and then drag then to cover other hours. Be careful, mistakes are easy to make!
Once you have hourly data, you can easily sum to get weekly data, monthly data, seasonal data, whatever interval you want data.
Midea 14kW (for now...) ASHP heating both building and DHW
@ivanhoew - yes, I agree, still a work in progress on the graphs! Try to make them clearer eg clearer x axis labels, delta what? etc. It's also not clear for example what the COP is. Momentary (spot, at that instant which isn't actually very meaningful at all)? Last minute (ditto)? It seems to me an hour is about the shortest interval for which a COP makes sense.
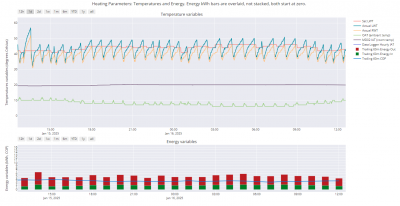
My standard monitoring chart has two plots, one for the temperature variables (minute data), and one for the energy variables, each bar being the trailing hour's values ie 1200 bar is the hour from 1100 to 1200. Strictly speaking the COP should be bars too but a line makes it much easier to read. This is what my chart for the last 24 hours looks like. The data is in csv files (one for minute data, another for hourly data) and the plots are produced using plotly, a python module:
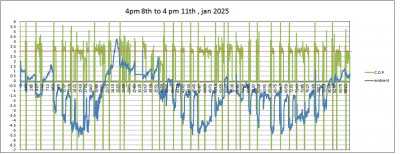
It shows typical low frequency cycling at moderate OATs. The steps in the OAT are due to the cooling effect of the heat pump on the local air when it is running. Your first chart appears to suggest the same thing, the dips in OAT coincide with the heat pump running.
Midea 14kW (for now...) ASHP heating both building and DHW
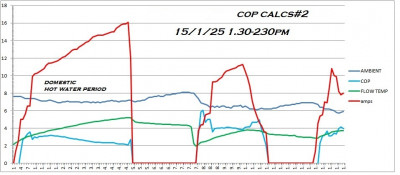
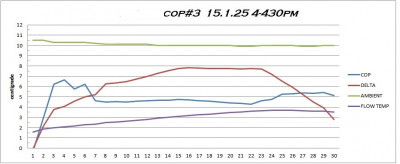
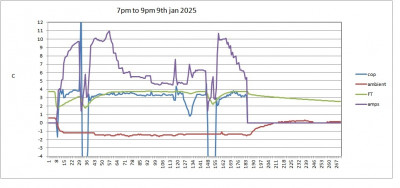
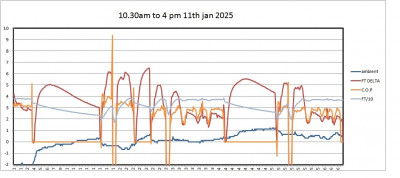
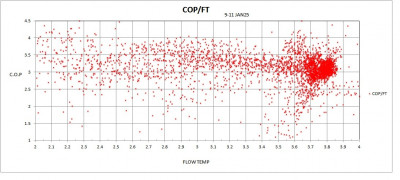
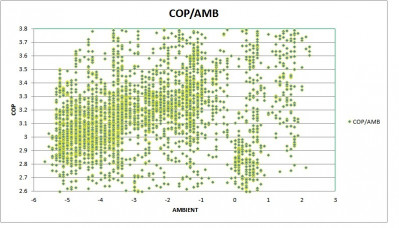
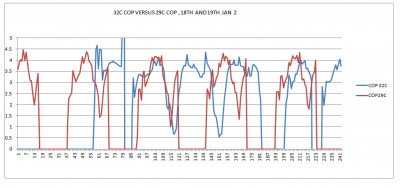
still gathering data to help me decide . a few more graphs i have compiled ..
Looking at these i can see best cop,so far , is about 29c FT , and evidence cop is worse as it gets colder , which i know is a given , but i like to start with the basics 🙂
I also noticed my worst cop is above feezing ,which is interesting , and prob due to me experimenting with a higher FT.
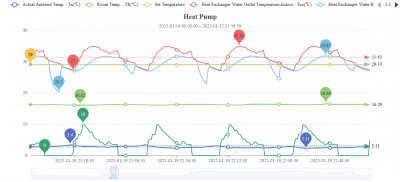
in the three day graph i am generally hovering in the 3- 3.5 range , over some pretly cold amb temps , so thats not too horrific .
regards
robert
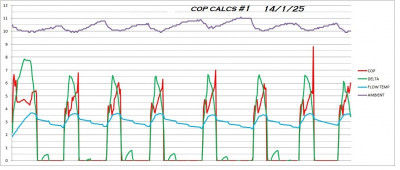
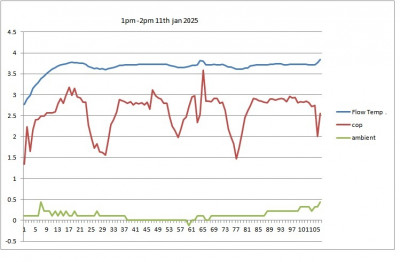
@ivanhoew - these charts are difficult to interpret because of inadequate labelling, and insufficient accounts of methodology. For example, in the first chart the COP is very volatile, and regularly dips to -7 or below. A COP of -7 is quite an achievement, even during a defrost cycle (when a COP might appear to be negative, because of the reverse energy flow, but even that is in a way an artefact of how we do the calculations, insofar as a negative COP doesn't really make sense)! How do you calculate the COP, and over what interval?
Posted by: @ivanhoewLooking at these i can see best cop,so far , is about 29c FT
I am not sure I can see any evidence for this. Can you point it out?
Midea 14kW (for now...) ASHP heating both building and DHW
I must say I echo what @cathoderay is saying here.
I hope what Im about to add doesn't offend you (and apologise if it does - its not my intent) - but is there any possibility you are overthinking this? Fundamentally heat pumps are pretty simple, at least in principle, to optimise (provided they dont have a buffer/PHE/LLH which complicates matters a lot):
- remove/disable all or most external controls and certainly any external thermostats, unless they have been specifically designed for heat pumps (only Homely at present SOFAIK)
- balance the emitters
- get the weather compensation adjusted as low as you can consistent with the house heating up to your required temperature, with the heat pump operated 24*7
- leave largely alone unless you are experiencing identifiable problems or want to tweak eg for a ToU tarif
To a very large extent you have to trust this, because making reliable comparative measurements of consumption, with a sufficient degree of accuracy to be meaningful, over a period less than several weeks (you possibly even need a whole season) is nigh-on impossible.
You also have to trust that the manufacturers of the heat pump know their system reasonably well, and if it cycles or displays other behaviours, its because it has to to satisfy the demand.
All of course subject to the assumption that there is no identifiable problem.
Of course its your system and you are entirely entitled to do whatever you like. There is no doubt this stuff is fascinating (if you like that sort of thing) and offers endless potential for playing around with scripting etc. There is also the possibility of playing 'top of the scops' on openenergymonitor, if you are that way inclined! That said there is also no doubt that it can become addictive.
Incidentally its entirely possible that worst COP is just above freezing. The wet climate plus cold temperature increases the need for defrost cycles (which sap energy and thus COP) and this is particularly true between 4 and 0. Once it gets below zero the air often becomes drier and, as the temperature falls further, quite noticeably so. Conditions don't always follow this pattern, but do so more often than not. Personally I find -4 more comfortable than +4 due to the (usual) difference in humidity!
4kW peak of solar PV since 2011; EV and a 1930s house which has been partially renovated to improve its efficiency. 7kW Vaillant heat pump.
Hi Robert
I have a very similar house to yours, and am considering installing a 12kW Harnitek combo.
Would love to compare notes on your install and costs - tried to PM you but as a new member I cannot until I have made 10 posts.
Can you either PM me your email, or can we start a topic based on the Harnitek combo?
Thanks
Jonathan
Posted by: @ivanhoewI have been trying to understand and achieve the best settings for my radiator water temperature on my heat pump.
My setup is , Harnitek 12 kw ashp .with internal 250 tank setup .this is called the Harnitek combo.
1865 farmhouse , shrewsbury, welshpool area , 180m elevation ...130m3 4 on 4 , shwiff system insulated all exterior walls ,270mm loft insulation ,pvc double glazing , with argon , one cavity wall full of poystyrene balls ,6 kw of panels and 4.9 kw battery . new heating radiators and piping to suit heat pump .
I tend to run the hs at 16c most of the time with 15c at night .
My question is , if i set the heat curve at 32c @ 3c ambient , i get one waveform , and if i set it at 31c ,i get a diferent one .and different cycling rates ..
Posted by: @jamespaIncidentally its entirely possible that worst COP is just above freezing. The wet climate plus cold temperature increases the need for defrost cycles (which sap energy and thus COP) and this is particularly true between 4 and 0. Once it gets below zero the air often becomes drier and, as the temperature falls further, quite noticeably so. Conditions don't always follow this pattern, but do so more often than not. Personally I find -4 more comfortable than +4 due to the (usual) difference in humidity!
Ah ! thats fascinating James thank you , that fills in the blanks as to why its working like that .
so ! i have done a little bit ....oh yes i have !
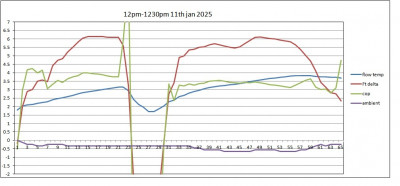
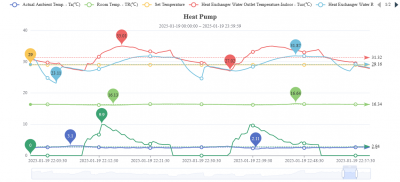
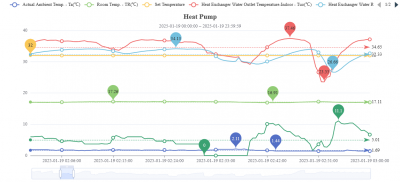
i found the areas of my logs that had ambient temps within a degree ish , and had a section of two hours each , one at 32c flow temps, (NOTE these are the inlet temps , so the high side of the average ). and one at 29c .
you can see the 29c one cycling more often , around 20 minutes gap .
cop for these is like this ..
i then picked out the smoothest hour for each period ..
which gave these cop numbers ..
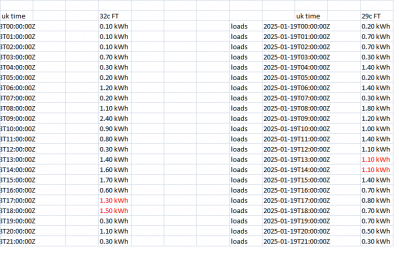
now i could go and look at my energy usage for those periods ..
These work out,for the two hour period , to 2.8 kw for the 32c Flow temps ,and 2.2 kw for the 29c flow temps .
for the single hour its 1.5 kw and 1.1 kw .
lets see how that correlates to the average amps used ..
2 hour period , 32c amps average is 4.47 amps , 29c amps average is 3.11 amps .
so 32c is 1.44 X 29c ...
1,437 X 2.2kw = 3.16 kw ,miles away from our 2.8 kw i measured .. so thats doesnt work out ,
lets try the 1 hour test period ..
averages are ..
2.94 amps for the 29cFT ,
and 5.01amps for the 32c FT .
power used was ..1.5kw and 1.1 kw .
so 1.7 x 1.1kw = 1,87 kw ,again not correct , so the average amps way of working it out doesn't seem a winner .
so , so far , it appears that the lower flow temps of 29c over 32 c , gives a 27-36% drop in kw used .
i have probably made loads of mistakes in my maths here , and will come back and edit it furiously later ! 🙂
regards
robert
- 26 Forums
- 2,417 Topics
- 54.8 K Posts
- 232 Online
- 6,096 Members
Join Us!
Worth Watching
Latest Posts
-
RE: Octopus Cosy 12 Heat Pump Regret: Incredibly Loud, Poor Heating & Constant Hum - Help!
So, after much anguish, and even visiting the neighbour...
By razz , 3 hours ago
-
MLCP (Multi-Layer Composite Pipe) for ASHP
@editor nope. The info you reported was sufficient for ...
By iotum , 6 hours ago
-
RE: Advice for a novice on Mitsubishi Ecodan 6kW
@robs Quick response while I'm in stationary traffic le...
By Sheriff Fatman , 6 hours ago
-
RE: Setback savings - fact or fiction?
Maths looks right to me, my only question about this ca...
By JamesPa , 6 hours ago
-
RE: Ideal HP290 14kW ASHP - how to optimise
@jamespa I wasn’t offended at all. You are very knowled...
By Davesoa , 7 hours ago
-
RE: Experience - New Build / Complete New Heating System
@vincro I would be surprised if it is much above 5 to 6...
By ASHP-BOBBA , 7 hours ago
-
RE: Recommended home battery inverters + regulatory matters - help requested
Yes, certainly not enough could have been tested in any...
By Batpred , 7 hours ago
-
RE: Post-Traumatic Heat Pump Stress Disorder
Yes bang on and maybe I can illustrate that by way of e...
By iotum , 9 hours ago
-
-

RE: Replacing my 18 month old Hitachi Yutaki ASHP
A big thank you to @jamespa for all his efforts online ...
By trebor12345 , 12 hours ago
-

RE: GSHP WOES! Midland based engineer recommendations?
@editor It is indeed for servicing. My current service ...
By Morgan , 13 hours ago
-
RE: Sunsynk Whole House Backup Issue
Hi @lostandconfused , I agree that topic/thread is the ...
By Batpred , 13 hours ago
-
RE: Speedcomfort radiator fans
In case it helps Andrew Kuhne on openenergy monitor has...
By JamesPa , 14 hours ago
-

Things have gone quiet with you @drei. Any updates?
By Mars , 17 hours ago
-

RE: Passiv Smart Thermostat - Help & Forum Support
Thanks @tim441. Interesting timing, as Passiv are a cur...
By Mars , 18 hours ago
-
Hi everyone, I have a two year old Marlec Solar iBoos...
By Tallmarc , 21 hours ago
-
RE: Please help with the settings ecodan
Are you trying to address any particular performance is...
By Sheriff Fatman , 1 day ago
-
RE: Solis inverters S6-EH1P: pros and cons and battery options
🤣 Well, I never managed to get the HA solis "...
By Batpred , 1 day ago

