Best temperature wave form for best economy and efficiency .
I have been trying to understand and achieve the best settings for my radiator water temperature on my heat pump.
My setup is , Harnitek 12 kw ashp .with internal 250 tank setup .this is called the Harnitek combo.
1865 farmhouse , shrewsbury, welshpool area , 180m elevation ...130m3 4 on 4 , shwiff system insulated all exterior walls ,270mm loft insulation ,pvc double glazing , with argon , one cavity wall full of poystyrene balls ,6 kw of panels and 4.9 kw battery . new heating radiators and piping to suit heat pump .
I tend to run the hs at 16c most of the time with 15c at night .
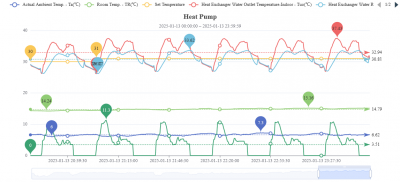
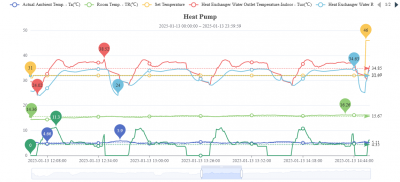
My question is , if i set the heat curve at 32c @ 3c ambient , i get one waveform , and if i set it at 31c ,i get a diferent one .and different cycling rates ..
which one is most desirable?
31c ..
32c
amps in green on the bottom line .
water return temps in pale blue .
its hard to work out which setting uses least power ,but then i am a total newbie.
oh , flow rate is 22l/m.
regards
robert 🙂
In general lower FT = higher efficiency.
These are only 1C apart however and with different outdoor temps, but perhaps more importantly both have an indoor temp of ~15. Is that your target indoor temp?
In general (in most cases) start by setting your FT as low as you can (with the heating operated 24x7 and all zone valves/TRVs fully open), consistent with the house being warm enough.
You can tweak starting from that point, but thats the starting point for max efficiency and usually lowest cost, unless you have a heat pump which is well oversized and a strong ToU tarrif.
4kW peak of solar PV since 2011; EV and a 1930s house which has been partially renovated to improve its efficiency. 7kW Vaillant heat pump.
The exact waveform does matter too much it’s the average that matters. I can’t read the scale too well but both shapes look reasonable. There’s no need to stress about tiny details.
Do you have a smart meter to compare with?
2kW + Growatt & 4kW +Sunnyboy PV on south-facing roof Solar thermal. 9.5kWh Givenergy battery with AC3. MVHR. Vaillant 7kW ASHP (very pleased with it) open system operating on WC
I find the graphs somewhat hard to reconcile against the references to 31 or 32 @ 3° ambient as in both the flow temperature seems to be targeted at the mid/high 30s and the ambient is a few degrees above 3. Surely the 11.3 noted against the power line can't mean its drawing 11.3kW?
I like the look of the second graph, fewer cycles and more periods of even output, but as JamesPa states the ambient temp (known round these parts as the OAT - Outside Air Temperature) is slightly higher and that alone will be enough to change the operational choices of the pump's software.
I suspect a 12kW sized unit is larger than you need for a medium-sized house that appears to be well insulated, and a target temperature of 15 or 16°C is on the low side requiring less heat to be generated. You may well be operating at the lower end of the capacity range of the pump already.
Mitsubishi EcoDan 8.5 kW ASHP - radiators on a single loop
210l Mitsubishi solar tank
Solar thermal
3.94kW of PV
Posted by: @ivanhoewMy question is , if i set the heat curve at 32c @ 3c ambient , i get one waveform , and if i set it at 31c ,i get a diferent one .and different cycling rates
which one is most desirable?
The second lower one is marginally among purists perhaps more desirable, but as @judith says, you don't need to stress about this.
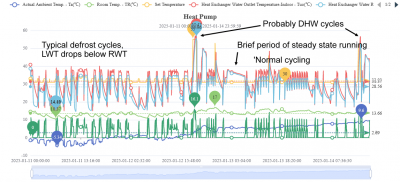
I'm pretty sure the two charts straddle the point at which your heat pump changes from mostly steady state running to cycling. The upper chart (LWT 31 degrees) is at the point where the heat pump has to cycle to modulate, the lower one (LWT 32 degrees is just into the range where it can manage at least some steady state running. Typically, heat pumps have three operations modes depending on LWT/OAT: a mid range where it can modulate parameters enough to achieve steady state, a higher OAT/lower LWT range where it has to cycle to reduce output sufficiently, and a lower OAT/higher LWT range where it uses defrost cycles.
If, as @harriup suggests, tour heat pump output is on the high side for the demand, the you will be more likely to get cycling, because there will be more times when the heat pump can't lower output enough without cycling. In general, the larger the heat pump, the higher it minimum as well as maximum output. This is one of the reasons why it is a good idea to match the heat pump output to the heat loss as closely as possible, just banging in large one makes it much more likely you will get cycling.
The cycling you have is relatively low frequency, maybe every 30 mins in the upper chart. Nil desperandum.
Midea 14kW (for now...) ASHP heating both building and DHW
Gosh ! thank you for all the replies , i'll quote each one and try to anser the questions in them ..
Posted by: @jamespaIn general lower FT = higher efficiency.
These are only 1C apart however and with different outdoor temps, but perhaps more importantly both have an indoor temp of ~15. Is that your target indoor temp?
In general (in most cases) start by setting your FT as low as you can (with the heating operated 24x7 and all zone valves/TRVs fully open), consistent with the house being warm enough.
You can tweak starting from that point, but thats the starting point for max efficiency and usually lowest cost, unless you have a heat pump which is well oversized and a strong ToU tarrif.
Thank you James , 15c is my indoor temp at night, 16c during theday .working outside on the banrs meanswhen i come in that feels quitewarm , then i use my tiny wood burner in the sitting room at tv supper time .
ihave been trying not using the thermostat in the hall , and setting the flow temp to keep the hs at 16 ,but i am concerned about the rapid cycling phenomenon , i can see the ashp is switching on and off more rapidly with the 31c , but from comments i can see here , it appears to be within acceptable parameters, and not about to hit a freqency of operation likely to damage itselt or the ears of the local dog population .
i have a suspicion than my heat pump is oversize .
regards
robert
Posted by: @judithThe exact waveform does matter too much it’s the average that matters. I can’t read the scale too well but both shapes look reasonable. There’s no need to stress about tiny details.
Do you have a smart meter to compare with?
Thank you Judith ,
i do have a smart meter ,and also the foxcloud and energy stats apps , however i find it a little hard to compare the exact power usage for each setting ,,,must try harder! keeping everything ,ext temp , internal temps, the same ,while varying the flow temps , and trying to compare energy used over a set time , is hard , i can see the amps used seemshigher on average wit hthe higher flow temps, but ,,,its cycling less times an hour too .....
i dont find this stress , just an interesting problem ,which uses less energy for the same hs heat .
regards
robert
Posted by: @harriupI find the graphs somewhat hard to reconcile against the references to 31 or 32 @ 3° ambient as in both the flow temperature seems to be targeted at the mid/high 30s and the ambient is a few degrees above 3. Surely the 11.3 noted against the power line can't mean its drawing 11.3kW?
I like the look of the second graph, fewer cycles and more periods of even output, but as JamesPa states the ambient temp (known round these parts as the OAT - Outside Air Temperature) is slightly higher and that alone will be enough to change the operational choices of the pump's software.
I suspect a 12kW sized unit is larger than you need for a medium-sized house that appears to be well insulated, and a target temperature of 15 or 16°C is on the low side requiring less heat to be generated. You may well be operating at the lower end of the capacity range of the pump already.
thank you HarriUp ,
I can see what you mean , and my guess is the flow temps are being measured at the pump , and ,by the time its got into the hs its dropped a touch , and then also its creating an average of 31, by exceeding then dropping beloww ,whcih over time creates that average temp .
yes! that is 11.3 kw !! ...scary,and depressing ,i just assumed thats how they all work .
i will admit , going from my old electricity usage , of 6 kw a day , to 20-30kw over the -9c days lately is a hell of a shock , especially at a house temp of 16c
but hey i must remember i am not burning 50-60 litres of heating oil a week .
Re the second graph , that is how i had been running it up to now . i am just starting to get into the system and whether its at its best ,due to the fact i can now data log and graph the design.
with this pump , i can program in 5 ambient temps , and 5 flow temps , so i have good control over the graph of amb/FT.
Yes , i think youre right re lower areas of this pumps capacity , a12 kw may well be too big . at ambient of 10c i can use 28-29 as my flow temps .
regards
robert
Posted by: @cathoderayPosted by: @ivanhoewMy question is , if i set the heat curve at 32c @ 3c ambient , i get one waveform , and if i set it at 31c ,i get a diferent one .and different cycling rates
which one is most desirable?
The second lower one is marginally among purists perhaps more desirable, but as @judith says, you don't need to stress about this.
I'm pretty sure the two charts straddle the point at which your heat pump changes from mostly steady state running to cycling. The upper chart (LWT 31 degrees) is at the point where the heat pump has to cycle to modulate, the lower one (LWT 32 degrees is just into the range where it can manage at least some steady state running. Typically, heat pumps have three operations modes depending on LWT/OAT: a mid range where it can modulate parameters enough to achieve steady state, a higher OAT/lower LWT range where it has to cycle to reduce output sufficiently, and a lower OAT/higher LWT range where it uses defrost cycles.
If, as @harriup suggests, tour heat pump output is on the high side for the demand, the you will be more likely to get cycling, because there will be more times when the heat pump can't lower output enough without cycling. In general, the larger the heat pump, the higher it minimum as well as maximum output. This is one of the reasons why it is a good idea to match the heat pump output to the heat loss as closely as possible, just banging in large one makes it much more likely you will get cycling.
The cycling you have is relatively low frequency, maybe every 30 mins in the upper chart. Nil desperandum.
Thank you cathodeRay,
It looks like neither flow temp graph is horrific , thats very reassuring , and i think the conversational trend is that my pump is a little on the big size .
I wonder if there's anything i can do to encourage steady state running to use less overall kw , would it be worth me running at say 33 or 34 c FT, and casuing a longer session of steady state , and fewer cycles per hr ?
by the way , i should point out the time scale on the bottom line is 8hrs advanced from uk time .
regards
robert
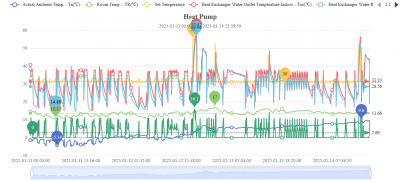
@ivanhoew - most if not all of what you need to understand your heat pump's behaviour is on the second chart. Here's an annotated version:
Midea 14kW (for now...) ASHP heating both building and DHW
- 26 Forums
- 2,396 Topics
- 54.3 K Posts
- 324 Online
- 6,077 Members
Join Us!
Worth Watching
Latest Posts
-
RE: Recommended home battery inverters + regulatory matters - help requested
This really helps. But I cannot work out the icon on th...
By Batpred , 5 minutes ago
-

RE: Fan is clipping ice build up from the front of unit.
Not sure if this helps, but the probes look like this. ...
By Mars , 10 minutes ago
-
RE: New Mitsubishi Ecodan 11.2kW installation - L9 errors and maybe more
So does that mean the rads are operating at the same fi...
By JamesPa , 15 minutes ago
-

RE: Running from backup generaor in powercut?
@transparent, super interesting. I had a long chat w...
By Mars , 22 minutes ago
-

RE: ASHP Energy Consumption: Aira 12kW heat pump
Indeed. Present ToU tariffs are based on national sup...
By Transparent , 3 hours ago
-
RE: Help me keep the faith with my air source heat pump installation
@adamk I'm observing my own system at low temperatures ...
By dr_dongle , 3 hours ago
-

RE: Free Ecoheat Heat Pump Install
@deltona Yes older houses are problematic like that, bu...
By bontwoody , 23 hours ago
-
RE: Radiator sizing sanity check
As I mentioned early on the cost of supplying and fitti...
By JamesPa , 1 day ago
-
RE: Advice for a novice on Mitsubishi Ecodan 6kW
I hadn't spotted that there were two pumps in the UFH (...
By JamesPa , 1 day ago
-
RE: Setback savings - fact or fiction?
Never assume it makes an ass of u and me! You need the...
By JamesPa , 1 day ago
-
RE: Electricity price predictions
Great point, one of the key ones in my chat with Octopu...
By Batpred , 2 days ago
-

RE: New Fogstar 15.5kWh upright solution
Let me point out that there are many Chinese suppliers ...
By Transparent , 2 days ago
-

RE: Weather compensation- why you should use it
@majordennisbloodnok — The Two Ronnies Mastermind sketc...
By cathodeRay , 2 days ago
-
Just realised that this image of the cylinder cupboard ...
By Sheriff Fatman , 2 days ago
-

RE: Rodents! A word of warning for heat pump owners
Two thoughts: 1: Let's ask @david-s if Primary Pro in...
By Transparent , 2 days ago
-
RE: Solis S6-EH1P8K-L-PLUS – Why I Chose It and What I’ve Learned So Far
In the diagram below, I describe my understanding of th...
By Batpred , 2 days ago
-
I need to have a look out for it. I know IBM feeds some...
By Batpred , 2 days ago
-
-
RE: Daikin Atherma ASHP Cycling 6 Times an Hour?
Thanks for your reply. Yes that's a good idea to try a...
By John Marshall , 2 days ago
-

RE: Hot water heating in parallel with space heating
An external heat exchanger would need a pump which woul...
By bontwoody , 2 days ago

