Heat pump efficiency v Outside Air Temperature
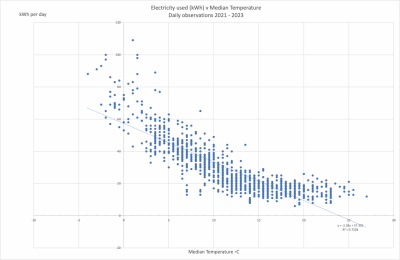
I have a 3 year daily record (over 1,000 data points) of kWh used and Max Min outside air temperature. I thought it would be interesting to scatter plot these and calculate the correlation.
The data is not perfect. kWh are total for our 100% electric home (ASHP is not separately metered). But I know from switching it off, while away in the summer, that other background use is about 8kWh per day (for fridges, freezers and Klargester). From April to September I have UFH off and the ASHP only heats our water. When away I use interpolation to fill in the gap between actual readings (so this gives an average daily kWh and a constant Min Max over the period). UFH is also off when away. These are relatively infrequent among a data set of 1,000 observations, so I think have little effect on the overall results.
The chart plots daily median temperature. Median is the mid point between Max and Min, as measured by an outdoor thermometer.
Not surprisingly the correlation at -0.85 is quite strong. I've also shown the best fit line but in fact I think the distribution of results would be better explained by a curve.
I'd summarise the observations as:
1) kWh changes very little for any temperature above 15C.
2) Between 15C and 5C the kWh increases steadily.
3) Below 5C the kWH increases much more rapidly.
4) From below 12C and certainly below 5C the spread of the results increases greatly (in the negative, ie more kWh, direction). This may be due to other factors such as humidity. If it's cold and damp the pump goes into the defrost death loop cycle and kWh increases even more.
Fortunately, as the plot shows, there are relatively few days with a median temperature below 5C. But of course it is on these that the kWh skyrockets. They are mostly in December and January which account for about 1/3rd of our annual kWh.
Mike
Grant Aerona HPID10 10kWh ASHP
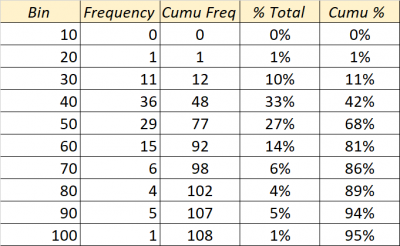
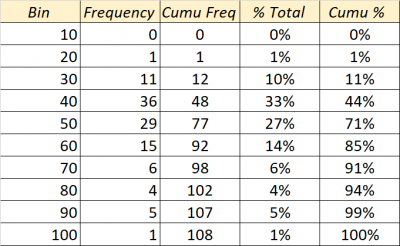
Very interesting @mike-patrick - I've been playing with something similar as our supplier recently started publishing our consumption data (and solar sent to grid) in 15 minute blocks, and backdated to August 2022, which has given me lots of lovely data to play with. Put me in mind of Protons for Breakfast analysis here which is also interesting in helping to illustrate the relatively few days of the year when consumption is skyrocketing. I did some quick analysis of my own total daily consumption data in our 100% electric house just for our last heating season (22-23, 108 days) in excel and it looked as below (bins 0-10kwh, 10-20kwh etc). I tend to scan through my consumption data and focus on the high outliers so its helpful for me to see these are relatively rare - e.g., 85% of winter days are below 60kwh. I'll do a plot of my data using your method and report back how it looks for my Daikin Altherma HT.
Incidentally I use https://www.visualcrossing.com/ for my weather data - free and a vast range of data - is your data from your own monitoring or third party?
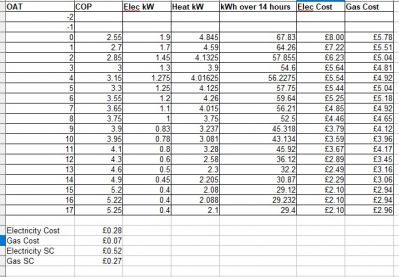
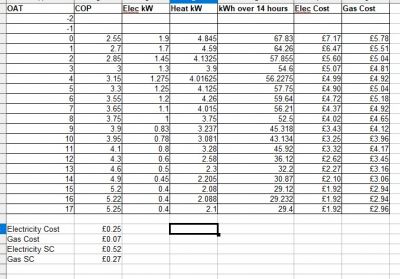
It must the be the time of year! I also did a similar analysis but using the COP obtained at different temperatures to compare the cost of gas and electricity for a 14 hour heating session. First using standard tariff price (28.12p/kWh) and then with a price closer to what I am actually paying (25p/kWh).
The last image show means day temperatures measured via a standalone sensor. The mean would obviously include the colder nightime temperature when I dont have my heat pump on.
House-2 bed partial stone bungalow, 5kW Samsung Gen 6 ASHP (Self install)
6.9 kWp of PV
5kWh DC coupled battery
Blog: https://thegreeningofrosecottage.weebly.com/
Heatpump Stats: http://heatpumpmonitor.org/system/view?id=60
@marzipan71 My temperature data comes from my own Max Min thermometer. This is carefully placed in the only point in the garden which is in the shade all day throughout the year.
Mike
Grant Aerona HPID10 10kWh ASHP
@bontwoody great minds etc... 🙂 Interesting way to cut the data - I think I'll run my numbers in a similar way - I don't have any COP data unfortunately. One thing - my cumulative percentage numbers are out on my table above - copy and paste error - correction here for the tape. Also I'm in Italy where the wholesale cost for electricity is 0.101 cents a kwh at the moment - after taxes and other charges, this works out at a 'real cost' on the bill of 0.25 cents per kwh (ie, my actual bill in euros divided by consumption), so was wondering if your 25p/kwh is the bottom line price on the bill divided by consumption also?
Posted by: @mike-patrickMy temperature data comes from my own Max Min thermometer.
Are you able to describe how you do this, what kit you use, and how you get the data into a computer? At the moment I use the sensor in the heat pump which clearly is affected by the heat pump, and I am keen to have an automated way of getting the 'true' OAT data.
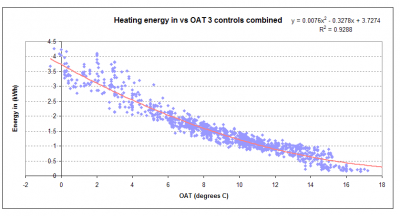
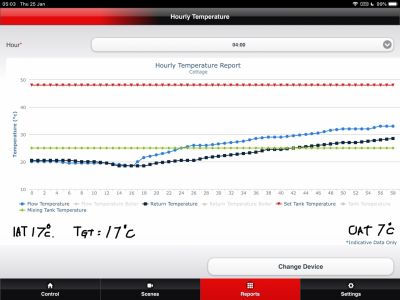
This is the sort of chart I get with my current data. Note this is hourly data, and I was looking at the relationship between OAT (as measured by the heat pump) and energy in, not out. The 'controls combined' in the title means the date is for three combined periods last year when I wasn't using setbacks:
This is for a Midea 14kW heat pump, but the basic pattern is very similar to yours.
Midea 14kW (for now...) ASHP heating both building and DHW
Very interesting. @mike-patrick
Interested in how big your house is since output is bigger than us in our 180 sq mtr house. Also do you have low loss header?
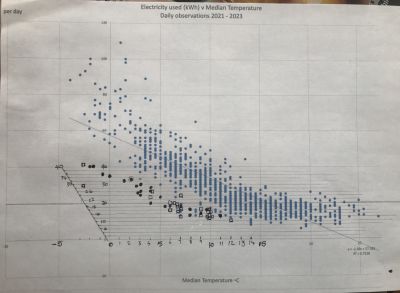
I’ve not got any data generating equipment but I’ve printed your chart and drawn my consumption data on it.
Square boxes are December data and black dots are January data. All collected off ecodan MELCloud daily outputs.
we have 14 radiators and no under floor heating.
@marzipan71 the 28p doesn’t include the daily standing charge. The 25p is a bit of a guess really as I have an EV and get very cheap overnight electricity which I also use to heat my water and charge my battery so about 8-9 kWh per night.
House-2 bed partial stone bungalow, 5kW Samsung Gen 6 ASHP (Self install)
6.9 kWp of PV
5kWh DC coupled battery
Blog: https://thegreeningofrosecottage.weebly.com/
Heatpump Stats: http://heatpumpmonitor.org/system/view?id=60
@sunandair My data collection is very simple - to match my technical knowhow. Each day take one reading of my MaxMin thermometer and the electricity meter, then write the numbers in a spreadsheet.
House is 150m2, fully insulated and with UFH downstairs and upstairs. Total kWh per year is 10,500. Given baseline consumption of say 10kWh per day that leaves about 7,000 kWh p.a. for heating and water, or about 47kWh per m2 per year.
I've always suspected that my ASHP (or perhaps I should say overall installation), which was newly installed 7 years ago when we refurbed the house, does not operate as efficiently as it should. I've no evidence for this but it seems that many on this site are achieving better results. However I've had it with heating engineers (inc those approved by Grant) who charge £'00s for a callout but then prove to have no clue as to how to check the system and suggest improvements. On the bright side we have got the kWh down to its current level from 15,000kWh back in 2020.
Yes, I think I have a low loss header. It's a big tank which had rusted through last year (so letting air into the system) and which I had replaced with a new stainless one. Local (Grant approved) heating engineer charged me lots of ££££s for this, as a result of which I will not use him again.
Mike
Grant Aerona HPID10 10kWh ASHP
@cathoderay It's just manual collection of data. I read my MAxMin thermometer and the electricity meter once a day and input the numbers into Excel. So, it runs to over 1000 lines of entries now.
Much as I would like to know the COP achieved by my ASHP I don't have the technical expertise ( or inclination tbh) to hook up other bits of equipment to it to try and calculate this number. It may be that the ASHP is performing correctly but that the rest of the installation of which it is a part is causing a loss of efficiency.
Mike
Grant Aerona HPID10 10kWh ASHP
Posted by: @mike-patrick@sunandair My data collection is very simple - to match my technical knowhow. Each day take one reading of my MaxMin thermometer and the electricity meter, then write the numbers in a spreadsheet.
House is 150m2, fully insulated and with UFH downstairs and upstairs. Total kWh per year is 10,500. Given baseline consumption of say 10kWh per day that leaves about 7,000 kWh p.a. for heating and water, or about 47kWh per m2 per year.
I've always suspected that my ASHP (or perhaps I should say overall installation), which was newly installed 7 years ago when we refurbed the house, does not operate as efficiently as it should. I've no evidence for this but it seems that many on this site are achieving better results. However I've had it with heating engineers (inc those approved by Grant) who charge £'00s for a callout but then prove to have no clue as to how to check the system and suggest improvements. On the bright side we have got the kWh down to its current level from 15,000kWh back in 2020.....
Mike
thanks for your response. It’s not easy to compare like for like installations since anything can be different between personal choices and preferred temperatures. For example we are happy having a room temperature of 20c in early daytime and only rise the temp to 21 from 6pm onwards.
likewise we also operate a low night time setback (16c) which means our heating goes off at 9pm and only starts to reheat at 4am so we assume this must save us some energy. Yet to be quantified. Having said that we try to achieve a minimum heating level of 20c between the hours of 8am to 10.30pm.
Third possible saving we may make is operating only 1 DHW cycle per day of only 30 minute duration. We have solar hot water but only get a small rise in water temperature at this time of year, on a sunny day but 30 minutes HP heating added to any solar gain seems to be enough for just 2 of us in the house.
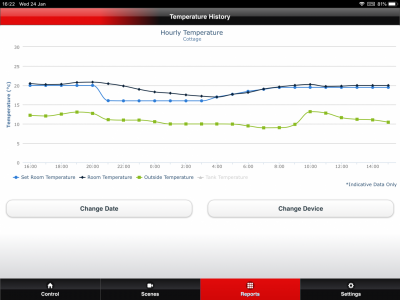
Here is a graph of our current setback 24 hour period. We have had to play around with the reheat temperature settings to try to achieve a slow recovery which keeps the HP output low. Otherwise the HP tries to operate at full power to rise the room temperature in what we think is an inefficient way.
Our current ramp-up reheat in the morning is a gentle DT4 or 6c which is about 4.4 to 6.6 kWh. It used to try to reheat at a rapid DT9 which is a big 10 kWh output (surprising for a 8.5 Ecodan)
This slow recovery reheat seems to be keeping the controller working without big swings in flow temperatures which used to cause us some temperature regulation problems.
@sunandair We leave the ASHP running at the same setting 24/7 (except when switched off in the summer or while away when its left on UFH only). We aim for a downstairs IAT of 20C. Due to the somewhat open plan layout, upstairs generally keeps itself warm enough (although not 20C) even though the UFH hardly seems to come on up there. The heated bathroom towel rails seem to provide enough room heat with the result that the tiled floors are always cold. Not quite what was intended. We have the DHW on twice a day, for the convenience of constant hot water although could no doubt survive with only 1 cycle to provide hot showers in the morning. House only has showers, no baths. If we have guests the DHW is switched to constant in the morning to ensure enough hot water for all. We don't have solar, partly because (pre the Russian invasion of Ukraine) the payback looked too slow and partly because the panels would look unsightly in a Cotswold village conservation area - but we do have a permitted development certificate for them should we change our minds.
Cost is certainly the major decision factor but lifestyle choice also comes into it. My wife thinks I obsess about the ASHP (although being "on" it means I spot problems quickly) but I'm at the stage now where I can't be arsed to fiddle with settings any longer. kWh usage seems to have settled into a regular pattern and I can live with £250 per month bills. It would take some time for savings from further improvements (if indeed those are possible) to even recover the cost of paying the right heating engineer to make the necessary changes. Unfortunately you can't tell, in advance, if a given heating engineer is "the one" who will deliver the goods!
Mike
Grant Aerona HPID10 10kWh ASHP
- 27 Forums
- 2,495 Topics
- 57.8 K Posts
- 352 Online
- 6,220 Members
Join Us!
Worth Watching
Latest Posts
-

RE: Solis inverters S6-EH1P: pros and cons and battery options
@jancold I only discuss data.. Fogstar were not impress...
By Batpred , 10 minutes ago
-
RE: What determines the SOC of a battery?
@batpred Ironically you didn't have anything good to...
By Bash , 44 minutes ago
-
RE: Testing new controls/monitoring for Midea Clone ASHP
Here’s a current graph showing a bit more info. The set...
By benson , 58 minutes ago
-
RE: Setback savings - fact or fiction?
True there is a variation but importantly it's understa...
By RobS , 58 minutes ago
-

Below is a better quality image. Does that contain all ...
By trebor12345 , 1 hour ago
-
Sorry to bounce your thread. To put to bed some concern...
By L8Again , 1 hour ago
-

@painter26 — they (the analogue gauges) are subtly diff...
By cathodeRay , 2 hours ago
-

RE: Electricity price predictions
I am always impressed with how you keep abreast of so m...
By Batpred , 3 hours ago
-
RE: Humidity, or lack thereof... is my heat pump making rooms drier?
@majordennisbloodnok I’m glad I posted this. There see...
By AndrewJ , 3 hours ago
-
Our Experience installing a heat pump into a Grade 2 Listed stone house
First want to thank everybody who has contributed to th...
By Travellingwave , 6 hours ago
-
RE: Struggling to get CoP above 3 with 6 kw Ecodan ASHP
Welcome to the forums.I assume that you're getting the ...
By Sheriff Fatman , 9 hours ago
-
RE: Say hello and introduce yourself
@editor @kev1964-irl This discussion might be best had ...
By GC61 , 10 hours ago
-

RE: Oversized 10.5kW Grant Aerona Heat Pump on Microbore Pipes and Undersized Rads
@uknick TBH if I were taking the floor up ...
By JamesPa , 1 day ago
-

RE: Getting ready for export with a BESS
I would have not got it if it was that tight
By Batpred , 1 day ago
-
RE: Need help maximising COP of 3.5kW Valiant Aerotherm heat pump
@judith thanks Judith. Confirmation appreciated. The ...
By DavidB , 1 day ago
-

RE: Recommended home battery inverters + regulatory matters - help requested
That makes sense. I thought better to comment in this t...
By Batpred , 1 day ago
-
Bosch CS5800i 7kW replacing Greenstar Junior 28i
My heat pump journey began a couple of years ago when I...
By Slartibartfast , 1 day ago
-

RE: How to control DHW with Honeywell EvoHome on Trianco ActiveAir 5 kW ASHP
The last photo is defrost for sure (or cooling, but pre...
By JamesPa , 1 day ago
-

RE: Plug and play solar. Thoughts?
Essentially, this just needed legislation. In Germany t...
By Batpred , 1 day ago
-
RE: A Smarter Smart Controller from Homely?
@toodles Intentional opening of any warranty “can of wo...
By Papahuhu , 1 day ago
-
RE: Safety update; RCBOs supplying inverters or storage batteries
Thanks @transparent Thankyou for your advic...
By Bash , 1 day ago
-
RE: Air source heat pump roll call – what heat pump brand and model do you have?
Forum Handle: Odd_LionManufacturer: SamsungModel: Samsu...
By Odd_Lion , 1 day ago
-
RE: Configuring third party dongle for Ecodan local control
Well, it was mentioned before in the early pos...
By F1p , 2 days ago

