I thought that when operating in WC mode, the LWT was the parameter being adjusted. Do you have charts for the LWT and RWT?
Correction from previous post due to rushing and over exuberant predictive text
Posted by: @sunandairThe reheat isn’t IS being deliberately created by setting the setback Temperature high enough so that the setback triggers an early reheat. And yes this will vary depending on OAT but it still boostS some the room temperature by 1.5 to 2 degrees which raises the start temperature of the reheat.
the principle isn’t overly complicated but doesn’t DOES speed up the reheat time
Posted by: @derek-mI would respectfully suggest that rather than the V x I x Correction Factor, a more suitable equation would be:-
Input Power = V x I + Auxiliary Power.
Where Auxiliary Power is the sum of the power used by the other equipment which is powered through the heat pump dedicated Power Meter.
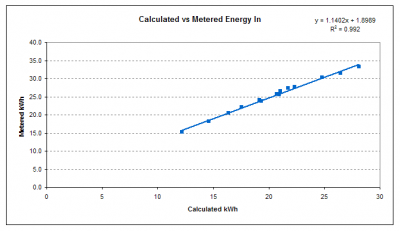
I've had another look at the data and found the only series where I read the external meter of a daily basis. It is a short run, for the period 0700 on 6th Nov 2023 to 0700 on 20th Nov 2023. I then plotted the uncorrected calculated kWh in against the metered kWh in for each 24 hour period in the series. Here is the calculated kWh in on the x axis and the metered kWh in on the y axis. I have done it this way round to get the actual regression equation:
There is a clear near constant linear relation between the two. R squared is 0.992 (>99%), about as good as you get in the real world.
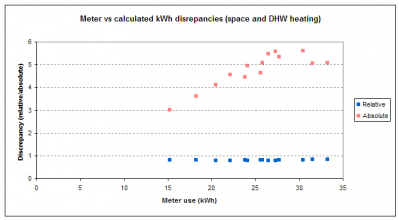
Here is another way of looking at the data: the relative difference (the ratio between the two) vs the absolute difference (metered minus calculated):
The relative difference stays constant, whereas the absolute difference varies.
I know this is counter-intuitive, if we choose to assume the difference reflects the standing charge. But what if the difference is part standing charge, and part something that does vary, depending perhaps on compressor activity?
I would respectfully suggest that the conclusion to be drawn from this limited but not unacceptable data is that that the calculated to metered correction is best done using a multiplication, not an addition.
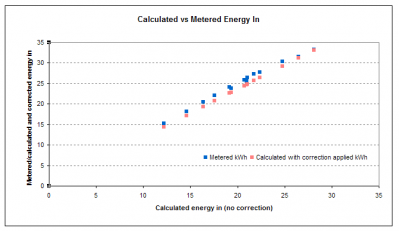
I could go back and use the regression equation to revise all the values, but life is too short, I could very easily end up corrupting the data, and the factor I used (1.18) gives values not too far from reality. The blue points are the metered values for each calculated value, the orange points the predicted metered value derived from the calculated value with the correction factor applied for each calculated value:
I don't know why this is the case. I don't think it has to do with the OAT (which did vary during the period, between around 7 and around 14 degrees), and in any event, the energy in is itself highly correlated with the energy in. Any thoughts welcome.
Midea 14kW (for now...) ASHP heating both building and DHW
Is there a particular reason why you keep changing the start time for the 24 hour test periods?
Posted by: @derek-mIs there a particular reason why you keep changing the start time for the 24 hour test periods?
Yes, to keep you on your toes 😉
Seriously, though, usually there is a reason, this time it is because the daily meter readings were taken at 0700.
Midea 14kW (for now...) ASHP heating both building and DHW
Could you please provide a copy of the data that you used to produce the most recent charts.
In the interests of science I'm going to take one for the team and switch to 24 hour operation. I'll then be able to compare with my setback data. It'll take a day or two for AA to settle down and then I'll wait till I have a few days.
I may have to curtail the experiment if Mrs M doesn't like it. Even worse will be if she does like it but it costs more. I'll report back on the results (Mrs M and the ASHP) in a week or so.
Could you please confirm the source of the data in the columns headed 'energy_in' and 'energy_out'.
Posted by: @cathoderayPosted by: @derek-mI would respectfully suggest that rather than the V x I x Correction Factor, a more suitable equation would be:-
Input Power = V x I + Auxiliary Power.
Where Auxiliary Power is the sum of the power used by the other equipment which is powered through the heat pump dedicated Power Meter.
I've had another look at the data and found the only series where I read the external meter of a daily basis. It is a short run, for the period 0700 on 6th Nov 2023 to 0700 on 20th Nov 2023. I then plotted the uncorrected calculated kWh in against the metered kWh in for each 24 hour period in the series. Here is the calculated kWh in on the x axis and the metered kWh in on the y axis. I have done it this way round to get the actual regression equation:
-- Attachment is not available --
There is a clear near constant linear relation between the two. R squared is 0.992 (>99%), about as good as you get in the real world.
Here is another way of looking at the data: the relative difference (the ratio between the two) vs the absolute difference (metered minus calculated):
-- Attachment is not available --
The relative difference stays constant, whereas the absolute difference varies.
I know this is counter-intuitive, if we choose to assume the difference reflects the standing charge. But what if the difference is part standing charge, and part something that does vary, depending perhaps on compressor activity?
I would respectfully suggest that the conclusion to be drawn from this limited but not unacceptable data is that that the calculated to metered correction is best done using a multiplication, not an addition.
I could go back and use the regression equation to revise all the values, but life is too short, I could very easily end up corrupting the data, and the factor I used (1.18) gives values not too far from reality. The blue points are the metered values for each calculated value, the orange points the predicted metered value derived from the calculated value with the correction factor applied for each calculated value:
-- Attachment is not available --
I don't know why this is the case. I don't think it has to do with the OAT (which did vary during the period, between around 7 and around 14 degrees), and in any event, the energy in is itself highly correlated with the energy in. Any thoughts welcome.
Presumably fan speed (and thus power drain) varies with compressor speed. I believe you said that your pump speed is constant and thus power consumption approx constant, I would expect the power consumed by the electronics to be constant or thereabouts. So its pretty certain you (and others) have both a fixed element and a variable element in addition to the power draw due to the compressor.
So far as I can see the Midea databook doesn't give the quiescent loads. I suspect somewhere there will be a document that does.
4kW peak of solar PV since 2011; EV and a 1930s house which has been partially renovated to improve its efficiency. 7kW Vaillant heat pump.
Could you please provide all the relevant data and information in a timely manner, so that a correct peer review of your suggestions can be made.
I had arrived at the same conclusion, but did not make comment since I did not wish to influence others.
From the table that I published, the power input to the heating system via the external kWh Meter would appear to consist of the following:-
The power used by the compressor derived from the V x I calculation. This of course will vary with compressor speed and loading, which may have a defined relationship with OAT.
The power used by the fan, the power rating of which I could not find in the Midea and Chofu documentation, though I do believe that there are some Modbus registers that contain the DC voltage and I think also the DC current. Compared to the compressor power draw it will be much lower, but again may have a relationship to changes in OAT.
For much of the time the water flowrate, and presumably the speed of the two water pumps is reasonably constant, so should not vary to any great extent with changes in OAT.
I suspect that the power consumed by the electronic circuits will be quite low, and to all intents and purposes could possibly be ignored.
From the table I produced from the raw data, it would appear that the hourly auxiliary power is in the order of 150W to 260W and is affected to an extent by variations in OAT, so I agree with your assessment that there is a relatively fixed component, and a component that probably varies with OAT.
Rather than spend time myself working out the possible underlying equations, I thought it more productive to let others do so, while I concentrate on optimising the spreadsheet to give the most accurate results that may be possible.
Posted by: @derek-mFrom the table I produced from the raw data, it would appear that the hourly auxiliary power is in the order of 150W to 260W and is affected to an extent by variations in OAT, so I agree with your assessment that there is a relatively fixed component, and a component that probably varies with OAT.
I would guess electronics 25-50W, pump 30-50W each. Fan is probably most of the rest. The electronics won't switch off during setback and there may be a sump heater which kicks in to keep the compressor oil warm. Without detailed specs not really possible to tell.
4kW peak of solar PV since 2011; EV and a 1930s house which has been partially renovated to improve its efficiency. 7kW Vaillant heat pump.
- 26 Forums
- 2,381 Topics
- 54 K Posts
- 265 Online
- 6,065 Members
Join Us!
Worth Watching
Latest Posts
-
RE: Who's your electricity provider and what's your tariff?
Worth adding that, for this tariff, the Octopus app has...
By Batpred , 21 minutes ago
-
RE: Advice for a novice on Mitsubishi Ecodan 6kW
Thanks @jamespa. I do feel a bit like an "all the gear,...
By Green_Fox , 23 minutes ago
-
@ecoste Interesting figures, thank you for sharing. F...
By Sheriff Fatman , 29 minutes ago
-
RE: New Fogstar 15.5kWh upright solution
ermm.. I do not have a monopoly on helping others to sa...
By Batpred , 33 minutes ago
-

RE: Insulating a pitched roof with kingspan, has anyone done it?
I suspect @agentgeorge is already aware of that, @batpr...
By Majordennisbloodnok , 33 minutes ago
-

RE: Setback savings - fact or fiction?
@cathoderay regarding Catchup I agree… this is the opin...
By SUNandAIR , 38 minutes ago
-
RE: Recommended home battery inverters + regulatory matters - help requested
Good to know. In the Solis, the soc can be used to s...
By Batpred , 42 minutes ago
-

RE: APP for remote Daikin ASHP Operation
Thanks, @newhouse87. Understood. I was only asking on...
By Majordennisbloodnok , 43 minutes ago
-
RE: Solar Power Output – Let’s Compare Generation Figures
@toodles I think you are correct. I just popped to the ...
By Papahuhu , 52 minutes ago
-
@mike-patrick A propos, I think my heat pump generates ...
By dr_dongle , 57 minutes ago
-

RE: Mitsu Zubadan flow temperature issue
Update: The flow temperature has now stabilized at 60C ...
By bontwoody , 2 hours ago
-
Balancing UFH flow rates, pump speeds etc
I have an old building with modern extension & ashp...
By Tim441 , 2 hours ago
-
RE: Advice on Vaillant Sensocomfort
I may have answered my own question. Telling the Senso ...
By dr_dongle , 3 hours ago
-

RE: Heat pump not reaching flow temperature
@johnd, I'd hesitate before saying that's definitely wr...
By Majordennisbloodnok , 3 hours ago
-
RE: Installer Fitted 9kW Instead of 11kW Heat Pump and Changed MCS Paperwork - What do I do?
@mairia Firstly its good to heat that cancelling setbac...
By JamesPa , 3 hours ago
-
RE: Say hello and introduce yourself
Thanks @jamespa. Much appreciated. I've read that Intro...
By Green_Fox , 5 hours ago
-
RE: Octopus Cosy Heat Pump Owners & Discussion Thread
You are doing well in January. Dec COP with my Vaillan...
By JamesPa , 8 hours ago
-
RE: Gen 6 Samsung ASHP losing 20C of DHW in 60 min directly after generation
That was what confused me! The heat pump FT is doing w...
By JamesPa , 10 hours ago
-

@renewables345 — thank you for the clarification. I'm r...
By cathodeRay , 10 hours ago
-
RE: Connecting Growatt SPH5000 over wired ethernet rather than wireless
Well well well.. turns out my WiFi dongle is actually t...
By z8lccda , 22 hours ago


