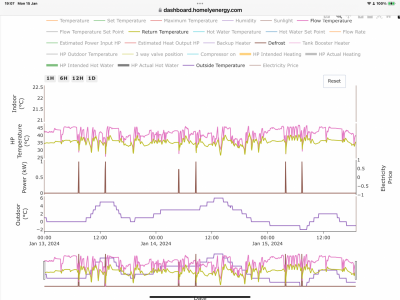
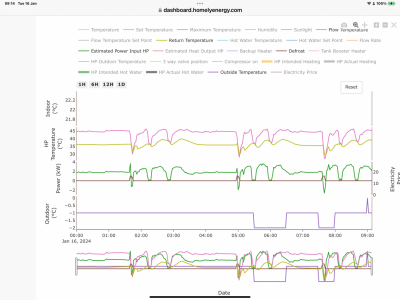
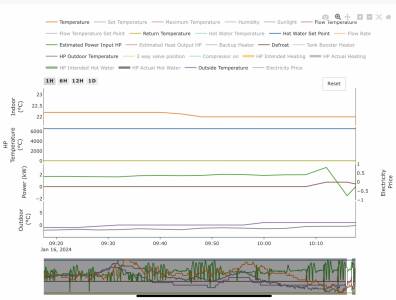
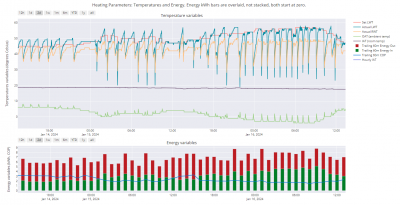
@cathoderay Here are the two flow temps plus the defrost markers - hope this makes things a little clearer. Regards, Toodles.
Toodles, heats his home with cold draughts and cooks food with magnets.
@toodles - yes, that makes sense, though I can't see the LWT magenta line poking out from the bottom of the fourth defrost in your latest chart. It may be a quirk of the way the lines are plotted. Perhaps try the zoom thing, click and drag on a PC, or whatever it is you do on a mobile to do the same thing. You should see the rectangle the page will zoom to (unless Homely have disabled that functionality) when you release the mouse button.
Midea 14kW (for now...) ASHP heating both building and DHW
Psychrometric trickery this week. It's cold outside, but low relative humidity. The sort of 'dry cold weather' that Scandinavia routinely gets, and why heat pumps can, perversely, often perform better in colder winter climates than in our mild and damp winters. It's all about the absolute moisture content. Any air cooling process that lowers the temperature of the air below the dew point produces condensate, at this time of year, as ice on the coil. The reduction in air temperature is sensible cooling, the generation of condensate (droplet or frozen) is latent duty. The combination added together is the total cooling. In and ASHP we are generating heating via a fluid cooled condenser, but the evaporator coil is simply an air cooling coil. Drier colder air has much less absolute moisture content that warmer damp air, so an ASHP can actually have a higher COP even when the outdoor temperature is cooler. To demonstrate the point, consider today: -1degC 70%RH, moisture content 2.43g/kg of air. More typically in the UK winter: 4degC 95%RH, moisture content 4.8g/kg of air. There's twice as much moisture in the warmer milder air temperature, and both temperatures will lead to condensate formation. The ice builds up far more quickly on the evaporator coil at 4degC than -1degC requiring regular defrost cycles. The absolute moisture content suspended in the air determines how much ice builds up on the ASHP coil and how often a defrost is required, not the air temperature.
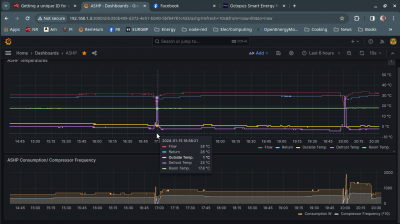
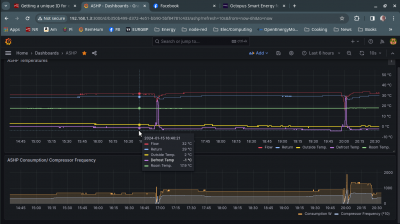
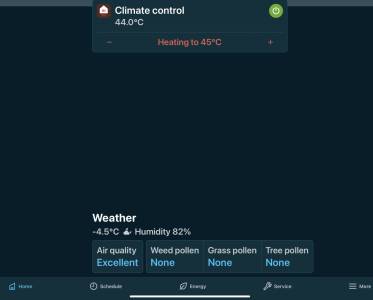
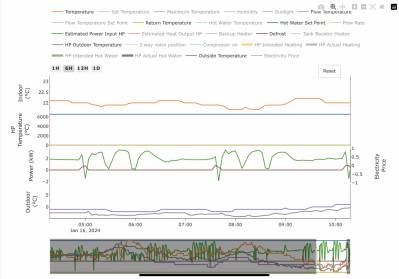
@allyfish A new plot of this morning’s pump performance along with the Onecta app report of temp. And humidity. If this still isn’t uncluttered sufficiently to discern the individual values, I’ll play around with my fingers on the iPad screen and see if I can enlarge a small section - but my attempts at doing so so far have been very ‘hairy’ as the display seems to go berserk as soon as I touch the display!!! Regards, Toodles.
Toodles, heats his home with cold draughts and cooks food with magnets.
@toodles that looks a lot clearer: 0145, 0500, 0745. you even have a brown line called defrost now so thats great - homely must be working that out from the temp changes, or perhaps even polling a register in the heatpump that says "I'm defrosting now". For comparison, I'm getting them every 4-6 hrs. due to this lowering in frequency COP is now slightly better than what the mfr spec number would suggest so happy with that!
does homely give you a short term COP?
My octopus signup link https://share.octopus.energy/ebony-deer-230
210m2 house, Samsung 16kw Gen6 ASHP Self installed: Single circulation loop , PWM modulating pump.
My public ASHP stats: https://heatpumpmonitor.org/system/view?id=45
11.9kWp of PV
41kWh of Battery storage (3x Powerwall 2)
2x BEVs
@iancalderbank The Short Term Coefficient of Performance (A new term! Shall we call it a STCOP?!) over the last two days it is 2.66 and just this day is 2.4 (we are experiencing -4.6C pre-sun rise). Another couple of ctaphs showing the last six hours and one hour and in these, the defrost cycles are visible. I thought to take a Homely check as I noted the heat pump was drawing ver little current though the radiator I felt was still warm (near the end of the pipe run though, I should have checked the bathroom one as this is the first in the pipe run.) Regards, Toodles.
Toodles, heats his home with cold draughts and cooks food with magnets.
Since the temp went below 0 yesterday afternoon, I had 7 defrosts in 11 hours.
ASHP: Mitsubishi Ecodan 8.5kW
PV: 5.2kWp
Battery: 8.2kWh
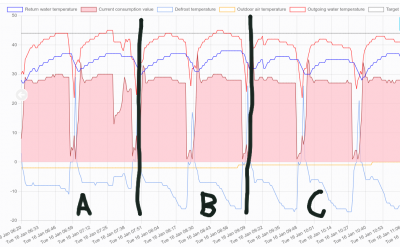
I've noticed three types of Defrost Cycle (or at least their impacts on performance) which are all nicely shown in today's data.
Overnight it was -3C to -2C, but dry. This is area A which shows "good defrosting" the LWT (red line) increases steadily, hits the target LWT (grey line), then falls off a cliff when the defrost cycle is required. This is defrosting, but performance is fine - energy getting to the house. The defrost temperature (light blue line) is fairly steady around -10C.
At around 7:00 the snow started, and by 8:00 this was having an impact. If you look at area B, the profile of the LWT line changes. There's still a steady incline to hit the target, but then it starts to fall away at the same rate. This is the impact of the lower defrost temperature (light blue line) as the moisture in the air now increases the amount of frost and ice on the HP.
Then since 09:00 with lying snow, area C, even though the outside temp is higher, the extra moisture is dragging down the LWT even more, such that the target LWT is never being reached. More energy is being used just to counter the extra load of the defrost temp heading towards -20C earlier within each cycle; 'defrost hell'.
This is defrost cycles every 40 minutes, which I think almost halves the 'usable time' I get from the HP.
Grant Aerona 3 10kW
Posted by: @toodles@iancalderbank The Short Term Coefficient of Performance (A new term! Shall we call it a STCOP?!) over the last two days it is 2.66 and just this day is 2.4 (we are experiencing -4.6C pre-sun rise).
great if homely gives you the daily COP. its a number worth keeping an eye on. The COP numbers you're getting sound decent to me. I don't know what HP you have and what its specs are, but mine ran at about 2.5 for a long period yesterday, OAT of -3C, LWT of 40C. the mfr spec for output/input at these temps for my HP (if I interpret it right) suggests 2.4.
My octopus signup link https://share.octopus.energy/ebony-deer-230
210m2 house, Samsung 16kw Gen6 ASHP Self installed: Single circulation loop , PWM modulating pump.
My public ASHP stats: https://heatpumpmonitor.org/system/view?id=45
11.9kWp of PV
41kWh of Battery storage (3x Powerwall 2)
2x BEVs
A heat pump on the verge of a nervous breakdown:
Miraculously, the current actual IAT is only 1.4 degrees below the desired IAT. But just look at those defrosts, and the LWT when it does get up to temperature, not to mention the hourly energy use, and a COP that drops to 1.49.
Midea 14kW (for now...) ASHP heating both building and DHW
@cathoderay ouch. that high LWT is killing it. I know you've said before that lack of physical space for bigger radiators is a big problem for you. Fan Coil units?
My octopus signup link https://share.octopus.energy/ebony-deer-230
210m2 house, Samsung 16kw Gen6 ASHP Self installed: Single circulation loop , PWM modulating pump.
My public ASHP stats: https://heatpumpmonitor.org/system/view?id=45
11.9kWp of PV
41kWh of Battery storage (3x Powerwall 2)
2x BEVs
- 27 Forums
- 2,495 Topics
- 57.8 K Posts
- 301 Online
- 6,220 Members
Join Us!
Worth Watching
Latest Posts
-

RE: Electricity price predictions
I am always impressed with how you keep abreast of so m...
By Batpred , 2 minutes ago
-

RE: Setback savings - fact or fiction?
I fully understand your reasoning, same steady inputs s...
By cathodeRay , 11 minutes ago
-
RE: Humidity, or lack thereof... is my heat pump making rooms drier?
@majordennisbloodnok I’m glad I posted this. There see...
By AndrewJ , 33 minutes ago
-
RE: What determines the SOC of a battery?
@batpred I didn't write the Seplos BMS software, I a...
By Bash , 2 hours ago
-
RE: Testing new controls/monitoring for Midea Clone ASHP
@tasos and @cathoderay thanks. I have some history grap...
By benson , 2 hours ago
-

I am having my existing heat pump changed to a Vaillant...
By trebor12345 , 3 hours ago
-
Our Experience installing a heat pump into a Grade 2 Listed stone house
First want to thank everybody who has contributed to th...
By Travellingwave , 3 hours ago
-

RE: Solis inverters S6-EH1P: pros and cons and battery options
Just to wrap this up here for future readers: The S...
By Batpred , 6 hours ago
-
RE: Struggling to get CoP above 3 with 6 kw Ecodan ASHP
Welcome to the forums.I assume that you're getting the ...
By Sheriff Fatman , 6 hours ago
-
RE: Say hello and introduce yourself
@editor @kev1964-irl This discussion might be best had ...
By GC61 , 8 hours ago
-

@painter26 — as @jamespa says, it's for filling and re-...
By cathodeRay , 11 hours ago
-

RE: Oversized 10.5kW Grant Aerona Heat Pump on Microbore Pipes and Undersized Rads
@uknick TBH if I were taking the floor up ...
By JamesPa , 22 hours ago
-

RE: Getting ready for export with a BESS
I would have not got it if it was that tight
By Batpred , 24 hours ago
-
RE: Need help maximising COP of 3.5kW Valiant Aerotherm heat pump
@judith thanks Judith. Confirmation appreciated. The ...
By DavidB , 1 day ago
-

RE: Recommended home battery inverters + regulatory matters - help requested
That makes sense. I thought better to comment in this t...
By Batpred , 1 day ago
-
Bosch CS5800i 7kW replacing Greenstar Junior 28i
My heat pump journey began a couple of years ago when I...
By Slartibartfast , 1 day ago
-

RE: How to control DHW with Honeywell EvoHome on Trianco ActiveAir 5 kW ASHP
The last photo is defrost for sure (or cooling, but pre...
By JamesPa , 1 day ago
-

RE: Plug and play solar. Thoughts?
Essentially, this just needed legislation. In Germany t...
By Batpred , 1 day ago
-
RE: A Smarter Smart Controller from Homely?
@toodles Intentional opening of any warranty “can of wo...
By Papahuhu , 1 day ago
-
RE: Safety update; RCBOs supplying inverters or storage batteries
Thanks @transparent Thankyou for your advic...
By Bash , 1 day ago
-
RE: Air source heat pump roll call – what heat pump brand and model do you have?
Forum Handle: Odd_LionManufacturer: SamsungModel: Samsu...
By Odd_Lion , 1 day ago
-
RE: Configuring third party dongle for Ecodan local control
Well, it was mentioned before in the early pos...
By F1p , 2 days ago
-

RE: DIY solar upgrade - Considering adding more panels
I know this is a bit old, but it made me wonder what co...
By Batpred , 2 days ago

