Posted by: @cathoderayHopefully though we won't have to deal with periods of negative energy input suggested by the wikipedia image that gets pulled in for the link.
I think we probably do:
Energy goes -ve several times. This was calculated using 30second DT x 30 second flow rate. There are times when the compressor stops (I know because the modbus tells me) DT goes -ve. and the flow rate carries on. thus the outdoor unit is sinking energy rather than sourcing it.
My octopus signup link https://share.octopus.energy/ebony-deer-230
210m2 house, Samsung 16kw Gen6 ASHP Self installed: Single circulation loop , PWM modulating pump.
My public ASHP stats: https://heatpumpmonitor.org/system/view?id=45
11.9kWp of PV
41kWh of Battery storage (3x Powerwall 2)
2x BEVs
Posted by: @bontwoody@derek-m lol, no measuring system is 100% accurate, quite apart from the limits of the equipment we could talk about quantum effects too 😆.
I guess accurately calibrated sensors, positioned appropriately with best contact to the medium possible and short measurement periods is the best we will manage. I think at the end of the day all most people are worried about is, is the system working efficiently?
That was the point that I was making. It is not necessary to have absolute accuracy to be able to optimise one's system with the data available. Problems arise when people measure the same parameter with different equipment and obtain different readings, which then creates doubts as to which, if any, are correct. To optimise one's system the goal should be to achieve improvements, whether they are being accurately measured or not.
Posted by: @bontwoodywe could talk about quantum effects too
One physics principle that I am certain will apply in the Heisenberg Uncertainty Principle. I've got a nasty feeling it might apply to power and energy: if we know the instantaneous power, we can't know the energy, and vice versa. Given we are trying to calculate energy from power x time, I've definitely got an uncertainty feeling situation coming on.
Midea 14kW (for now...) ASHP heating both building and DHW
@cathoderay And when you arent looking at it, it will be doing something different! 🤣 🤣 🤣
House-2 bed partial stone bungalow, 5kW Samsung Gen 6 ASHP (Self install)
6.9 kWp of PV
5kWh DC coupled battery
Blog: https://thegreeningofrosecottage.weebly.com/
Heatpump Stats: http://heatpumpmonitor.org/system/view?id=60
Posted by: @bontwoody@cathoderay And when you arent looking at it, it will be doing something different! 🤣 🤣 🤣
Are you certain? How do you know if you are not looking at it? 🙄
@derek-m Those bloody quantum particles are all the same! 🤣
House-2 bed partial stone bungalow, 5kW Samsung Gen 6 ASHP (Self install)
6.9 kWp of PV
5kWh DC coupled battery
Blog: https://thegreeningofrosecottage.weebly.com/
Heatpump Stats: http://heatpumpmonitor.org/system/view?id=60
It is quite possible to have COP values ranging from 2 to possibly even 5 on the same system. What is important is understanding why, and the reasons for the variations. It is not just a matter of measuring various parameters, accurately or otherwise, it is also a matter of understanding the information that the measurements are providing.
For those who are not familiar with measurement techniques and systems, it may be useful if I explain a few things.
A glass thermometer is a quite simple analogue temperature measuring device, which I could watch continuously to see how the reading changes with variations in the temperature around the thermometer. But if instead of watching the thermometer continuously, I take a reading at 1 minute intervals, the overall effect is more like a digital measuring system. If the thermometer is measuring the temperature within a room, I would probably be hard pressed to see any noticeable difference even over 10 minute, or longer, periods of time, so I could decide to take readings every 10 minutes. If the thermometer is now placed in front of a fan heater, which is being switched on for 4 minutes and then off for 4 minutes, there will be occasions when the thermometer is measuring a blast of hot air, and occasions when the temperature is much lower, but it would not be immediately obvious what is happening other than the temperature is varying. If I now revert back to taking measurements at 1 minute intervals, I would stand a much better chance of understanding that the fan heater is being switch on and off on a regular basis. The frequency at which measurements are taken can therefore be important in digital measuring systems.
Looking at the data sheet for the DS18B20 Digital Thermometer, it has a quoted accuracy of +/- 0.5C, and also has a programmable resolution of 9 to 12 bits. When the device is carrying out the conversion from analogue to digital at 12 bits resolution, this takes a specified maximum of 750 ms, so the highest possible measurement frequency would probably be 1 reading per second, which should be more than adequate for temperature measurement.
Let's now consider why measurements may be varying.
It could be that the overall temperature of the liquid within the system is varying, due to slight changes in the compressor outlet temperature and/or pressure, or it could be that the heat transfer rate within the condenser is varying slightly, or the flow rate through the system is varying slightly, or the heat transfer rate at the heat emitters is varying slightly, or any combination of the above.
A further cause could be that the liquid around the temperature sensor is not completely mixed, so the actual temperature measured by the sensor is varying.
Whatever the reason, the first thing to decide is if it is necessary to measure the variations at a high frequency, and take account of them within any calculations, or should these frequent measurements be averaged, or should readings be taken less frequently, which again may need to be averaged? If averaging is performed should it be over a fixed period, or should it be a rolling average? A rolling average would probably produce a smoother display, but again that is dependent upon how frequent the display is to be updated.
The following code could possibly be used to produce a rolling average, the result of which could be used in subsequent calculations.
Temp_10 = Temp_9
Temp_9 = Temp_8
Temp_8 = Temp_7
Temp_7 = Temp_6
Temp_6 = Temp_5
Temp_5 = Temp_4
Temp_4 = Temp_3
Temp_3 = Temp_2
Temp_2 = Temp_1
Read Temp_1
Rolling_Average_Temp = Sum(Temp_1 to Temp_10)/10
By varying the timing at which the code is run, and then displaying at that frequency, it should be possible to smooth out the graphical display.
As far as quantifying energy consumption from an electrical energy meter is concerned using the output pulses, the first thing is to know how much energy 1 pulse denotes. If 1kWh = 1000 pulses, then 1 pulse = 1Wh.
By counting pulses over a given time period, or periods, it should be possible to quantify the amount of electrical energy consumed. Consumption at a rate of 1kW would generate 1 pulse every 3.6 seconds, whilst a rate of 10kW would provide pulses every 0.36 seconds.
1kW totaled over 1 minute should capture 17 pulses most of the time, with the occasional reading of 16. If these values were used in any calculations, then 17 pulses would give an hourly total of 1.02kWh, and 16 pulses would give an hourly total of 0.96kWh. So using 1 minute totals will introduce a level of error.
If instead the pulses were counted over a 10 minute period, the results would be 167 pulses would give an hourly total of 1.002kWh, and 166 pulses would give an hourly total of 0.996kWh. It is obviously necessary to reset the counter to zero at the commencement of a new timing period.
The longer the time period, the more accurate the result.
Quantifying the heat energy produced is again a matter of totaling instantaneous values over a time period, but rather than waiting for pulses to appear, it is necessary to obtain values at fixed time intervals. The more frequent the time interval, but the longer the time period, the more accurate the result is likely to be.
Posted by: @bontwoodyAnd when you arent looking at it, it will be doing something different!
Next up will be Berkeley's quote about the falling tree, but that has the rare distinction using itself to obliterate itself, because no one heard him say it.
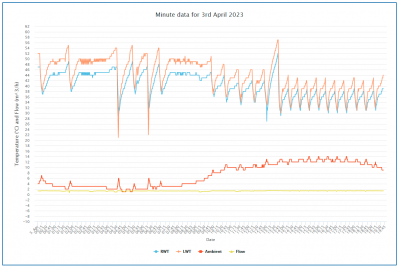
Here's today's minute data for ambient temp RWT/LWT, and flow rate, useful insofar as it was cold overnight (we had a frost):
It looks as though there may have been some quite savage defrost cycles in the early hours, between 0430 and 0630. It's always good to know one's heat pump is kindly warming up the garden (ambient spikes) on a cold winters night when no one is there. The middle of the day RWT/LWT spike is the DHW heating coming on.
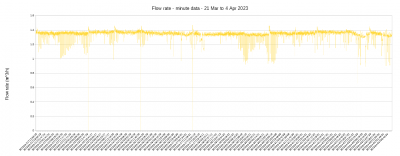
The flow rate, as ever, remains remarkably constant, which has always baffled me, because it means the only way the heat pump can alter its output is by increasing and decreasing the LWT/RWT delta t, which maybe it does in fact do (looks a bit larger overnight than during the day). The day time period also looks as though there's a lot of cycling going, maybe it is also using that to control output.
Once I have got interactive zooming enabled on these charts I will zoom in and see what is happening in more detail over a shorter period.
Midea 14kW (for now...) ASHP heating both building and DHW
The shown flow is really very constant and poor also. Looks like the pump is not able to change the flow. Especially for dhw heating it could be not enough. Here the displayed flow changes from 0,6m³/h to 1,3m³/h(8.4kW) with possible maximum in dhw heating.
Posted by: @gormThe shown flow is really very constant
I have remarked on this many times, because it is almost always 1.3 something m^3/h (Midea's chosen unit) and it does seem odd that it doesn't vary, because it is the obvious thing that should vary to control output, if you want to keep the delta t fairly constant at around 5 degrees. Here's a quick plot of flow rate over the period for which I have minute data (data collected every minute). As you can see the vast majority of the readings are in the 1.3 something range:
Midea 14kW (for now...) ASHP heating both building and DHW
so, I've changed horses with regard to the COP and performance aspects. Using homeassistant I'm now pushing everything that I get from the samsung modbus into openenergymonitor emoncms as there's already loads of work been done there. Wasn't hard to get working, I can write it up if people are interested. Need to wait a few days for that to get some data thats of value.
@cathoderay I'm not sure I agree 100% about your flow being too low : 1.3m/h could be enough, depending on your house, emitters , DT . according to my ready reckoner at DT6 (I think thats where you're at ?) 1.3m/h gives about 10kW of throughput. but your flow temps do look very high and there's definately some cycling going on, so something needs thinking about. and its curious that both flow and DT never change (apart from when off)? is it feasible that its actually doing 10kw - off - 10kw - off?
what is the physical setup? Is it PWM controlled by the heat pump or fixed speed or is it an Auto (Proportional Pressure Curve) type setup?
My octopus signup link https://share.octopus.energy/ebony-deer-230
210m2 house, Samsung 16kw Gen6 ASHP Self installed: Single circulation loop , PWM modulating pump.
My public ASHP stats: https://heatpumpmonitor.org/system/view?id=45
11.9kWp of PV
41kWh of Battery storage (3x Powerwall 2)
2x BEVs
Posted by: @iancalderbankI'm not sure I agree 100% about your flow being too low
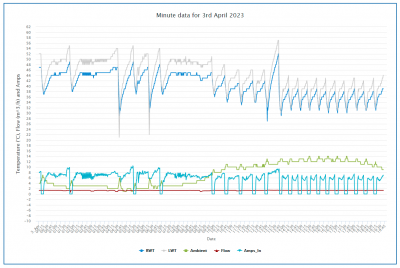
I'm not so worried that it too low (it probably is within an acceptable if low-ish range), bu rather that it is so constant most of the time. The flow temps are high because I have a high left hand end to my weather curve, 58@-4, to get enough heat into the house in cold weather without having ridiculously large rads, not a good idea in a small listed cottage. If you look at the 3rd April chart below, overnight when it was cold and it wasn't defrosting, the LWT was 48-50 degrees, the RWT 44-45, so delta t about right, around 5 degrees. During the afternoon, when it was significantly warmer outside, the delta t drops to about 3 most of the time. But the striking thing about the afternoon period is the apparent cycling. This is confirmed by adding (compressor) Amps_In as a proxy for whether the compressor is on or off:
Not sure about the internal (primary circuit) water pump, but as luck would have it my installer is coming to do the annual service tomorrow, so I should be able to find out them. Or maybe the answer is buried in the modbus data somewhere.
Midea 14kW (for now...) ASHP heating both building and DHW
- 27 Forums
- 2,495 Topics
- 57.8 K Posts
- 353 Online
- 6,220 Members
Join Us!
Worth Watching
Latest Posts
-

RE: Solis inverters S6-EH1P: pros and cons and battery options
@jancold I only discuss data.. Fogstar were not impress...
By Batpred , 12 minutes ago
-
RE: What determines the SOC of a battery?
@batpred Ironically you didn't have anything good to...
By Bash , 46 minutes ago
-
RE: Testing new controls/monitoring for Midea Clone ASHP
Here’s a current graph showing a bit more info. The set...
By benson , 60 minutes ago
-
RE: Setback savings - fact or fiction?
True there is a variation but importantly it's understa...
By RobS , 1 hour ago
-

Below is a better quality image. Does that contain all ...
By trebor12345 , 1 hour ago
-
Sorry to bounce your thread. To put to bed some concern...
By L8Again , 1 hour ago
-

@painter26 — they (the analogue gauges) are subtly diff...
By cathodeRay , 2 hours ago
-

RE: Electricity price predictions
I am always impressed with how you keep abreast of so m...
By Batpred , 3 hours ago
-
RE: Humidity, or lack thereof... is my heat pump making rooms drier?
@majordennisbloodnok I’m glad I posted this. There see...
By AndrewJ , 3 hours ago
-
Our Experience installing a heat pump into a Grade 2 Listed stone house
First want to thank everybody who has contributed to th...
By Travellingwave , 6 hours ago
-
RE: Struggling to get CoP above 3 with 6 kw Ecodan ASHP
Welcome to the forums.I assume that you're getting the ...
By Sheriff Fatman , 9 hours ago
-
RE: Say hello and introduce yourself
@editor @kev1964-irl This discussion might be best had ...
By GC61 , 10 hours ago
-

RE: Oversized 10.5kW Grant Aerona Heat Pump on Microbore Pipes and Undersized Rads
@uknick TBH if I were taking the floor up ...
By JamesPa , 1 day ago
-

RE: Getting ready for export with a BESS
I would have not got it if it was that tight
By Batpred , 1 day ago
-
RE: Need help maximising COP of 3.5kW Valiant Aerotherm heat pump
@judith thanks Judith. Confirmation appreciated. The ...
By DavidB , 1 day ago
-

RE: Recommended home battery inverters + regulatory matters - help requested
That makes sense. I thought better to comment in this t...
By Batpred , 1 day ago
-
Bosch CS5800i 7kW replacing Greenstar Junior 28i
My heat pump journey began a couple of years ago when I...
By Slartibartfast , 1 day ago
-

RE: How to control DHW with Honeywell EvoHome on Trianco ActiveAir 5 kW ASHP
The last photo is defrost for sure (or cooling, but pre...
By JamesPa , 1 day ago
-

RE: Plug and play solar. Thoughts?
Essentially, this just needed legislation. In Germany t...
By Batpred , 1 day ago
-
RE: A Smarter Smart Controller from Homely?
@toodles Intentional opening of any warranty “can of wo...
By Papahuhu , 1 day ago
-
RE: Safety update; RCBOs supplying inverters or storage batteries
Thanks @transparent Thankyou for your advic...
By Bash , 1 day ago
-
RE: Air source heat pump roll call – what heat pump brand and model do you have?
Forum Handle: Odd_LionManufacturer: SamsungModel: Samsu...
By Odd_Lion , 1 day ago
-
RE: Configuring third party dongle for Ecodan local control
Well, it was mentioned before in the early pos...
By F1p , 2 days ago


