Testing new controls/monitoring for Midea Clone ASHP
Hi all,
I thought it might be of interest to others if I document a bit about the above, which is mainly the removal of Homely from our system and the installation of something that essentially uses the manufacturers controls via home assistant, particularly as the native control panel for Midea, and their app, are not great. Over this heating season the plan is to compare how we get on both in terms of comfort levels, and costs, so hopefully this will be a good test.
Background:
Firstly, a bit about the system, which we've had for just over a year. 160sq m house, with very average insulation so we're never going to be running particularly low flow temps. 16 radiators in total, with estimated heat losses just under 8kW and a 12kW Clivet (midea) installed.
Overall, we did not have the smoothest of experiences with our installers. There were a lot of issues with general quality of workmanship, being left a cold room or two, and not being able to achieve the reported design max flow temp of 45 at minus 2. At minus 2 generally we'd need outlet temps of around 47/48 to keep our house warm, after a bit of trial and error.
The installers recommended homely and we went for this, which works ok but our general feeling was that it left us with too little control and I personally didn't like that end users have to go through the back door to access their installer dashboard. It also exhibited some slightly strange behaviours with overshooting.
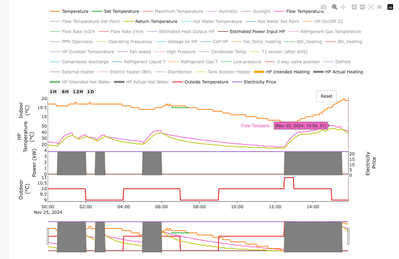
Here's an example of some of the isssues we had with Homely:
You can see in the graph above that Homely set the flow temp at 50/51 when there was no need to do so. Quite mild outside and the heating essentially was off for a few hours. This would happen once or twice a week and just generally didn't seem to quite align with the low and slow principles.
New controls:
I researched a lot of potential options, and even contacted Clivet themselves who interestingly just recommended getting an on/off thermostat and connecting this to the ASHP.
Not being a fan of the above (mainly due to advice on here), I looked at other options. Planet Atmo seemed like a good option for pure weather comp and was compatible with Midea. This would link to the ASHP via the modbus in the same way Homely does, and allowed a lot of controllable parameters and monitoring, via their app. However, they wouldn't supply direct to the public so that ruled them out.
I have tried the Midea Smarthome app but it is quite basic, and it just keeps disconnecting with the control panel. I had been able to relink it but now I just can't get it to work at all so I've given up on that.
I then came across a Midea ASHP controller called Svenar. I couldn't fully work out what this device offered, truth be told, but it sounded like it might work so at around £65 I thought we'd give it a punt. It connected via modbus and then allowed control/monitoring via home assistant.
Home assistant- We in fact already had this. I purchased the HA green a while back and in fairness hadn't really been using it that much, with only one automation set up for a smart plug on our tumble dryer to notify us when it had finished! For those who aren't familiar, the best way to describe it is an open source system/repository that allows connection and integration of a load of smart devices in your home. You can then set up automations so if something happens to one smart device (or entity within that device so for a temp and humidity sensor the particular entity could be selected as the temperature reading) it can then influence another separate device to run a command. The HA green is a straight out of the box solution which was very easy to set up.
Svenar- when it arrived, again very simple to set up and this was immediately discoverable in home assistant, which was a good start.
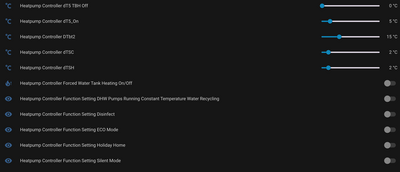
What I didn't realise, which was a massive bonus, was just how many parameters of my ASHP I'd be able to see, and control, within home assistant via Svenar. There are around 200 odd, and hopefully this screenshot gives an idea which is a very small snapshot:
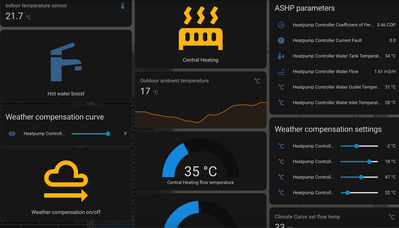
Now I cannot profess to know what all of these parameters mean, but a bit of googling, and delving into the instruction manual, allowed me to pick off the key ones that I wanted both viewable, and controllable, in a separate dashboard rather than having to trawl through the list of hundreds. Again, for those that don't know much about HA it allows one to create custom dashboards with cards, or buttons that will display certain entities and allow toggling on/off, changing values etc.
It's also worth pointing out that HA works really well on a smartphone so the above dashboard I created is very easy to read there. Even the wife commented that it was easy to use and turn on the heating- a decent endorsement indeed...
As you can see on the above, I've added the parameters for the WC curve so I can easily tweak this as required once we see how we get on when the weather turns.
Putting it to the test:
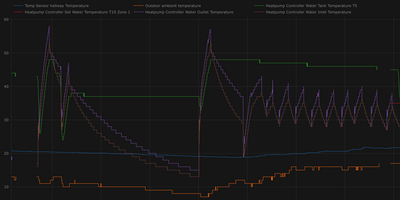
Today as it happens was a bit chilly, so I turned the heating on for the first time (we generally like the house to be around 20.5 so when it dipped to 19 we found it a bit cold). We are actually a radiator down at the moment because I'm redoing our kitchen, which includes the removal and relocation of the radiator. Anyway, I've set up all of the relevant parameters in a graph, as per this screenshot:
Thus, so far seemingly so good and generally the outlet/inlet graphs seem to be pretty much typical of a midea, slowly rising to the set outlet flow temp before cycling.
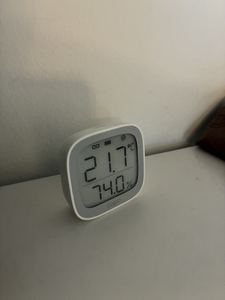
Going back to the automations in homely, I have temp sensors in all of the upstairs bedrooms, and one in the hallway. This one in fact, which is a tapo:
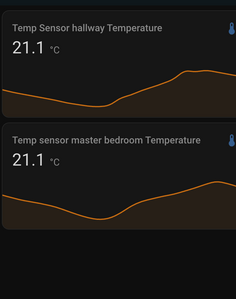
Having these sensors then allows me to link and monitor these all either via the tapo app, or again via home assistant:
I have set up an automation so that when the temperature rises above 21.5, this reduces the values for the WC curve within the heat pump controller, the intention being that this will hopefully slowly reduce heating output to reduce overshooting. Whether this works as intended remains to be seen, as I'd accidentally disabled this automation without realising when I had the heating on today, and then wondered why it didn't work...
Anyway, this is where I have got to so far. Hopefully as said this is of some interest and will update in terms of how we get on. COP for today was around 4.8, from the midea control panel so seems ok. Incidentally homely would generally estimate the COP at around 0.5 above whatever the midea control panel would specify. I have kept the homely for now, in its box and if it transpires that this way of operating it needs too much fiddling or doesn't work as well, I can re-install it. I'd rather not though as it has been rather liberating ditching it, and it's algorithms, simplifying it and taking back full control. Please also feel free to critique any of the above as I would not class myself as an expert by any stretch, with plenty still to learn about how to optimise ones ASHP.
@benson - looks like good work, and thanks for posting here in sufficient detail to allow others to get started along the same lines if they want to do so.
The parameters and controls available over modbus and their cryptic names are listed in the Midea and most clones wired controller manuals in a table towards the end of the manual. Some are read only ('get'), others are read and write ('get' and 'set') including most usefully the weather compensation curve end point settings, as you have discovered. You may recall I have a python auto-adapt script which does what you HA automation does, tweaks the WCC when the room temp is above or below where it should be. Generally this approach works well, WCC does most of the control, with the auto-adapt script doing the tweaking when needed. The script runs once an hour, and includes a function which logs what it does in a csv file so I can see what it has been doing.
The homely charts are hideous, a very good lesson in how not to do charts. The HA charts can be very variable. I personally don't really like dark themes, but that is entirely personal choice. More to the point, the X axis always needs to show the time line, otherwise the chart is just random doodling, and personally unless there is an ultra-compelling reason to do otherwise the Y axis should always show zero, to avoid visual distortions eg a change from 30 to 31° over 24 hours can be made into a gee-whizz chart simply by setting the Y axis range from 29 to 32°. For what it is worth, here is an example of a chart from my DIY (not HA) modbus monitoring system showing essentially the same thing as your fourth image less the DHW data:
My charts are done using plotly, which is I believe what homely uses, reading in my case the data from csv files. The overnight cycles are not Midea 'normal' cycles, they are defrost cycles, marked by the LWT dropping below the RWT, and happened because the OAT was in defrost territory. The periods either side are slightly unusual, as there is no 'normal' Midea cycling, because the OAT is in the sweet spot range, between about 6 and 8°, where the heat pump runs without cycling. The IAT remained remarkably stable throughout the period shown.
One interesting thing about your chart is it doesn't show spikes in the OAT. In my chart above, these spikes are exaggerated, because the cycles are defrost cycles, but they are also present, but less marked, with 'normal' cycling, and have caused much past debate about what the 'real' OAT is. That said, I use the data from the OAT sensor in the outdoor unit, which is of course what the WCC uses to determine the set LWT, so in a way it is the OAT, as far as the heat pump is concerned, whatever the 'real' OAT is, which is nonetheless what the building heat loss depends on. I wonder, are you using the same Midea outdoor OAT sensor, or do you have an independent one that isn't influenced by whatever the heat pump is doing? or maybe it is a resolution thing. My data is 'minute data' ie a reading once a minute, and so it picks up short term changes, maybe your system uses a longer interval, which might miss short term changes?
Midea 14kW (for now...) ASHP heating both building and DHW
@cathoderay Just to say that the newer version of the Homely Connect app seems to be using a different charting arrangement and no longer even mentions ‘Plotly’; I find it difficult to use the time bar facility and it lacks the fine resolution of the Plotly version. It may be me of course… Toodles.
Toodles, heats his home with cold draughts and cooks food with magnets.
@cathoderay yes there is the modbus register list at the end of the manual and that makes sense what you say about read and write, so those are the ones I can change.
I am using the plotly add on in home assistant for that graph and my fault regarding the x axis- I cut it off slightly when doing my snip screen capture, so that is showing time. Your graph does definitely look better than my attempt for sure so maybe I will tweak it over time. I think suffice to say I can't really see how any end user can fully track and optimise how their ASHP is running without some form of monitoring in this format hence why I just found the homely policy of 'installer only' for their equivalent dashboard so odd.
My intention is certainly that the overshooting adjustment is employed sparingly and fundamentally the correctly set WC curve should keep things ticking along nicely.
As for OAT- this is just the sensor within the unit itself that I am using. There is a lot of space around the unit and it is a fair distance away from the wall as well so perhaps a bit less of a microclimate? Not sure.
Anyway as you can see from my custom dashboard the SCOP (it has been almost exactly a year now since we've had it) is around 3.5. I wasn't able to retrieve SCOP from the homely dashboard- only COP over last 28 days I think it was- but generally as said this would be estimating around 0.5 higher typically than what the midea controller would display. Which one is more accurate I have no idea but the benchmark of 3.46, and of course our energy costs over the last 12 months, is what I can compare this set up to.
Generally I'm surprised about the limited options we have, and there's no manufacturers equivalent that allows for user friendly remote adjustment of settings, monitoring etc. If it wasn't for the Svenar I probably would have gone with the Planet atmo and would have had to bite the bullet to get a tradesperson in to connect a few wires. The irony being with homely, we had a lot of issues with the DHW over the early summer period- the reason for this being water ingress in an outside junction box that our installers put in, and a loose modbus wire that they hadn't tightened properly which I only discovered when removing the homely device itself.
Again with home assistant my plan is to install a display somewhere- perhaps the Shelly one or just an android tablet that I can wall mount.
Posted by: @toodlesIt may be me of course
I doubt it, many 'improvements' are quite the opposite.
Posted by: @bensonAs for OAT- this is just the sensor within the unit itself that I am using. There is a lot of space around the unit and it is a fair distance away from the wall as well so perhaps a bit less of a microclimate? Not sure.
The problem with using this sensor at detailed enough resolution to see the spikes is that it is difficult to know what the real OAT is, and that does matter because that is what largely determines the building's heat loss. Or perhaps it doesn't for everyday running purposes, in that the Midea OAT will bear some relationship to the real OAT, and as long as the WCC takes any offset into account, then all will be well. Where it does get more critical is when attempting to model the whole system, because the wrong OAT will mean the wrong heat loss.
When the heat pump is using defrost cycles, I suspect the real OAT is somewhere between the baseline and the peaks. The baseline is I suspect cooler than the true OAT, influenced by the cooler exhaust air, and then during the defrost cycle the heat pump exhausts warmer air, and this elevates the Midea OAT.
I do have an independent OAT monitor (standalone RC-4 monitor of the type I've mentioned before) but it only records the OAT on an hourly basis (in a coal bunker on the opposite side of the house for about six month). Its a bit of a faff to get the time stamps to align with the Midea data, but at some point I will plot the two together and see what they suggest.
Midea 14kW (for now...) ASHP heating both building and DHW
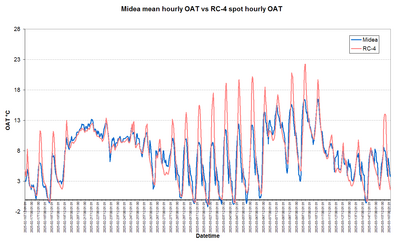
The weather being what it is, gales then showers round here, I have used the time to plot the Midea OAT against the standalone RC-4 data logger OAT. They are not quite the same thing: the Midea data is the average OAT over an hour, the RC-4 data is the spot OAT towards the end of the hour. The Midea data, being an hourly average, has lost the cycle assiciated spikes visible in the minute data. Perhaps more importantly, the heat pump faces east, and is in partial shade from trees, while the RC-4 data logger was in a west facing coal bunker with no shade on the bunker. This is what a month of the data from last spring looks like, a month's data because longer periods scrunch the data too much:
Much of the time, they are actually quite close. The higher RC-4 peaks are almost certainly artefacts caused by solar gain, given the coal bunker gets the benefit of the afternoon sun, which the heat pump does not. In practice, I suggest this means the Midea OAT does give a reasonable approximation to the real OAT most of the time. @jamespa, I would be most interested in your thoughts.
Midea 14kW (for now...) ASHP heating both building and DHW
Posted by: @cathoderayThe weather being what it is, gales then showers round here, I have used the time to plot the Midea OAT against the standalone RC-4 data logger OAT. They are not quite the same thing: the Midea data is the average OAT over an hour, the RC-4 data is the spot OAT towards the end of the hour. The Midea data, being an hourly average, has lost the cycle assiciated spikes visible in the minute data. Perhaps more importantly, the heat pump faces east, and is in partial shade from trees, while the RC-4 data logger was in a west facing coal bunker with no shade on the bunker. This is what a month of the data from last spring looks like, a month's data because longer periods scrunch the data too much:
Much of the time, they are actually quite close. The higher RC-4 peaks are almost certainly artefacts caused by solar gain, given the coal bunker gets the benefit of the afternoon sun, which the heat pump does not. In practice, I suggest this means the Midea OAT does give a reasonable approximation to the real OAT most of the time. @jamespa, I would be most interested in your thoughts.
Interesting. The minute data previously showed very distinct jumps in the Midea sensor when the heat pump switched on (downwards jump) or off (upwards jump, albeit of a lesser magnitude) which got larger as the OAT decreased. The average jump magnitude was about 3C at OAT6 down to 0.5C at OAT12.
Im not sure whether this is apparent or not in the latest data; , on balance I would say it isn't but its difficult to be certain what's happening on days when temperatures are changing quickly, which it typically is on the colder days.
Have you got enough of this that we could put the RC-4 data into buckets, compare it to the Midea data at the same time (perhaps differentiated according to whether the heat pump is on or off) and see if it correlates with the previous figures?
Its a bit disturbing when two presentations of the same phenomenon lead to apparently different results so it would be good to reconcile this by drilling down if the data is available.
4kW peak of solar PV since 2011; EV and a 1930s house which has been partially renovated to improve its efficiency. 7kW Vaillant heat pump.
@jamespa - I think the key thing is the current (as in the chart above) Midea data is the average over the previous hour, and so we lose sight of the spikes. But it may also be telling us something - the spikes don't add up to very much overall - I'm thinking about how much they contribute to the AUC (area under the curve), as it were. But I think the real question here is can we use the Midea hourly average OAT as a proxy for the real OAT, and if we can, do we need to add (or subtract) a correction?
I think the RC-4 OAT data set I have to date, which is really only a couple of months of hourly data from last spring, probably isn't large enough to put into buckets. Come the heating season, which surely is not far away now, I can either carry on collecting the same hourly data, or alternatively I could set the RC-4 to collect minute data, and perhaps find somewhere to put it on at least the same side of the house as the heat pump, but not so close that it gets affected by the heat pump.
Midea 14kW (for now...) ASHP heating both building and DHW
Posted by: @cathoderay@jamespa - I think the key thing is the current (as in the chart above) Midea data is the average over the previous hour, and so we lose sight of the spikes. But it may also be telling us something - the spikes don't add up to very much overall
In a way I would like to agree with the final conclusion, but I can't yet. The transitions with switch on and off weren't spikes, they were shifts so far as I could tell from the data.
Unfortunately I think (as I think you suggest) we need more data to understand what's actually happening. I don't see that we need minute data from the external sensor, oat simply doesn't change that quickly. However if minute data is practical it won't do any harm and may allow noise reduction. Alternatively data every 10-15 mins might be ok. I do think we need minute data from the heat pump because of the relationship to on/off.
This has turned out to be an investigation of its own unfortunately which may well turn out to be a blind alley, but one we need to understand I fear.
4kW peak of solar PV since 2011; EV and a 1930s house which has been partially renovated to improve its efficiency. 7kW Vaillant heat pump.
Posted by: @jamespaThis has turned out to be an investigation of its own unfortunately which may well turn out to be a blind alley, but one we need to understand I fear.
I agree. The OAT is fundamental, it is both a major determinant of heat loss and, with weather compensation, the major determinant of what the heat pump does. I think we do need to know what we are actually measuring, and what the effective OAT(s) is/are, ie the one that the building experiences, and the one the heat pump responds to, which may or may not be the same. We do already know what the heat pump OAT sensor reports, but how does the heat pump respond? Does it use an average, and if so, over how long? How often is the OAT sampled, to determine the set LWT via the WCC?
Here's an hour from early last November when the OAT was moderate and fairly stable, showing the OAT, set and actual LWT, RWT and IAT. What is actually going on?
Midea 14kW (for now...) ASHP heating both building and DHW
Homely sounds like a good product, but I have reservations about their headline claim that the average home can save up to £444 per year.
Their test at Salford University uses a base case of a fixed flow temperature of 55C, regardless of external temperature, to compare with Homely. The test produces the saving of £444 per year.
They also run a test using a weather compensation base case for comparison. The set points for WC are 55C at outside temperature of -3C, and 30C at outside temperature of 16C. This test produces a saving of £158 per year. See:
https://www.homelyenergy.com/homely-saves-up-to-444-per-year-for-customers-with-tou-tariff/
Both base cases use pretty high flow temperatures, so I wonder what the real savings would be.
Of course, Homely might argue that these numbers are appropriate for some systems, and that the savings can be extrapolated to systems with lower flow temperatures.
Grant Aerona 290 15.5kW, Grant Smart Controller, 2 x 200l cylinders, hot water plate heat exchanger, Single zone open loop system with TRVs for bedrooms & one sunny living room, Weather compensation with set back by room thermostat based load compensation
Here's a four hour period from the same morning last November. Why does the set LWT change when it does? The OAT is lower when the heat pump is active (actual LWT is rising), is this simply the exhaust air cooling the local OAT a bit? What is the real OAT? That which appears when the heat pump is not active?
Midea 14kW (for now...) ASHP heating both building and DHW
- 26 Forums
- 2,367 Topics
- 53.7 K Posts
- 145 Online
- 6,042 Members
Join Us!
Worth Watching
Latest Posts
-
-
RE: Who's your electricity provider and what's your tariff?
@majordennisbloodnok This may be a better thread to ...
By Batpred , 11 hours ago
-
RE: Help needed with Grant Aerona 3 issues
Noted. Its a pity you didnt capture the flow rate and ...
By JamesPa , 16 hours ago
-

RE: Best Heat Pump Brand in the UK
Last Call to Vote & Win! Haven't voted for your Hea...
By Mars , 16 hours ago
-

RE: Solis S6-EH1P8K-L-PLUS – Why I Chose It and What I’ve Learned So Far
Interesting question. To be frank, since I have no inte...
By Majordennisbloodnok , 23 hours ago
-
RE: Changing from 4-port buffer to volumizer
@andy1618 see the very sage advice from @editor above. ...
By JamesPa , 1 day ago
-
RE: New Fogstar 15.5kWh upright solution
The video shows the JK balancer, but the connection of ...
By Batpred , 1 day ago
-
RE: Ecodan unable to hit legionella target temp - what's the consensus?
@9jwr9 Hi, yes this is the issue with every (stand alon...
By ASHP-BOBBA , 2 days ago
-
RE: Help me keep the faith with my air source heat pump installation
@adamk FWIW I managed unintentionally to 'coax' mine in...
By JamesPa , 2 days ago
-
RE: Octopus Cosy Heat Pump Owners & Discussion Thread
You are in essence right. Adia only works with selecte...
By JamesPa , 2 days ago
-

No, you haven’t missed out, @batpred. This thread’ll st...
By Majordennisbloodnok , 2 days ago
-

RE: Tesla Powerwall – More of a ‘Luxury’ Than an ROI Winner!
Also, though they weren’t prepared to match the price t...
By Toodles , 2 days ago
-
RE: How long will your energy contract last?
My INTELLI-FIX-12M-25-08-29 has less than 12 months to ...
By Batpred , 2 days ago
-

RE: GivEnergy 2025 forthcoming batteries and inverters
Then, perhaps @toodles , you should've made a submissio...
By Transparent , 2 days ago
-
RE: Balancing financial efficiency and comfort using the Octopus Cosy tariff
I am wondering if anyone with an EV could find the 7p/k...
By Batpred , 2 days ago
-
Possibly, but it would also reduce DeltaT across the em...
By JamesPa , 2 days ago
-

RE: ASHP sizing - value of Heat Transfer Coefficient
@cathoderay It was reminiscent of the BBC Open Universi...
By Toodles , 2 days ago
-
-

@morgan They are unsupervised these days, can’t get the...
By Toodles , 5 days ago

