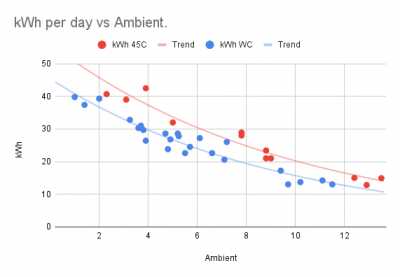
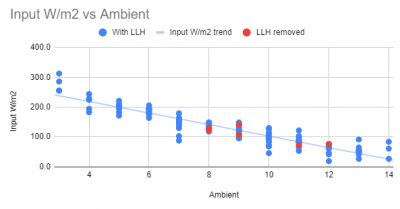
I think that I am correct in assuming that the graphs show the energy input to the heat pump, which if that is the case, then the result will not be linear.
Because the efficiency of an ASHP is not constant, but reduces as the ambient air temperature falls, then at lower ambient air temperatures it will require relatively more energy from the electrical supply, since it is absorbing a lower proportion from the ambient air.
Plotting similar data from a gas or oil boiler should show a more linear relationship.
@cathoderay I'm not sure what "R" is. But it's just a Google sheet. You can see it in my signature if you want to make your own copy and fill in your data
Posted by: @kev-mMy scatter diagrams don't look quite linear either!!
They are not that far off, though. What your plot does show is that for any given ambient, having a constant flow temp rather than weather comp is less efficient (more energy is used). That relationship is fairly constant: at 10 degrees ambient, 16 vs 20kWh, at 5 degrees ambient, 27 vs 34kWh, ie about 25% more energy is used when running in constant flow temp mode. That difference is not trivial. The only caveat is that I have assumed that the weather was similar, ie it didn't just happen that on all the weather comp days, there was significant solar gain, which was absent on constant flow temp days (and that no other unaccounted for factor was at work). Recording just kWh used last spring, I had a similar picture, significantly more energy use running in constant flow temp mode.
Your chart, especially if it can be replicated by others, would seem to answer the question which is more efficient, constant flow mode or weather comp mode? The answer is weather comp mode, by about 25%.
@derek-m - good point if it is energy in rather than energy out, but it is not entirely clear which it is: @batalto's energy use ranges from around 20 to over 80, @kev-m's from around 14 to 40, but the difference could simply be different property/lifestyle factors.
@batalto - R is a statistical/plotting package that produces attractive minimalist charts like yours and @kev-m's chart. It is fiendishly complicated to learn and use, that's why I an always impressed by someone who has mastered its use.
Midea 14kW (for now...) ASHP heating both building and DHW
@cathoderay for comparison of systems I personally prefer the W/m2 measurement. As that removes the size factor and gives you a standardised way of comparing efficiency
@batlto - agreed, that makes sense, and is definitely an improvement, but there are also other significant factors eg my old poorly insulated building will all other things being equal consume more energy than a similar modern well insulated building. It is like all these things where there is a trade off between the usefulness and complexity of standardisation (and I suppose I should add we shouldn't forget the albeit remote possibility of Simpson's paradox, that summary measures can paradoxically reverse effect sizes). Luckily, much of the time we are comparing like with like, ie performance in our own property over time with different set ups, which absolutely controls for property variations, unless we have made significant changes to the fabric, and even then the results are still useful, eg energy use before and after fitting secondary glazing, or, as in your recent case, before and after removal of the LLH.
Midea 14kW (for now...) ASHP heating both building and DHW
@cathoderay this is my W/m2 for the house - if that helps you could compare it to your own given you can easily work out (if you dont already know) the size of your floor space
Posted by: @cathoderayPosted by: @kev-mMy scatter diagrams don't look quite linear either!!
They are not that far off, though. What your plot does show is that for any given ambient, having a constant flow temp rather than weather comp is less efficient (more energy is used). That relationship is fairly constant: at 10 degrees ambient, 16 vs 20kWh, at 5 degrees ambient, 27 vs 34kWh, ie about 25% more energy is used when running in constant flow temp mode. That difference is not trivial. The only caveat is that I have assumed that the weather was similar, ie it didn't just happen that on all the weather comp days, there was significant solar gain, which was absent on constant flow temp days (and that no other unaccounted for factor was at work). Recording just kWh used last spring, I had a similar picture, significantly more energy use running in constant flow temp mode.
Your chart, especially if it can be replicated by others, would seem to answer the question which is more efficient, constant flow mode or weather comp mode? The answer is weather comp mode, by about 25%.
@derek-m - good point if it is energy in rather than energy out, but it is not entirely clear which it is: @batalto's energy use ranges from around 20 to over 80, @kev-m's from around 14 to 40, but the difference could simply be different property/lifestyle factors.
@batalto - R is a statistical/plotting package that produces attractive minimalist charts like yours and @kev-m's chart. It is fiendishly complicated to learn and use, that's why I an always impressed by someone who has mastered its use.
Yes constant flow was less efficient in my experiment. It's slightly flawed because my numbers include a small amount of DHW (about 2kWh/day) and I made no allowance for different weather.
The other point is that using WC only keeps the house temperature more constant so is a lot more pleasant. The stats make the temperature bounce around a bit, which (to me) is noticeable.
Like @batalto, I used google sheets. I do remember R from a while back though...
The results from the 24 hour test run are in. The ambient temps from the local weather station and the Midea app are in very close agreement, suggesting the Midea app isn't using a moving average, apart from an anomaly between 0400 and 0800 this morning when the Midea app was between 1 and 3 degrees higher. It may have been defrost cycles, but unlikely, as the ambients never went below 5.7, and most of the time were over 6. The Midea curve looks less credible so I favoured the local weather station temps. The hourly rooms temps from the data logger were between 18.5 and 19.8. I transferred data from the Midea app into the spreadsheet manually, the other data was already in spreadsheet form and so I just copied them across.
For each hour I calculated the estimated building heat loss using the (room temp - ambient temp) x 0.539, and then divided that heat loss by that hour's reported energy consumption from the Midea app, and got an hourly COP. These varied rather widely, between 2.05 and 6.09, perhaps because of lags and/or rounding (all the hourly usage figures are integers), but the average of the COPs over the 24 hour period was a credible 3.16. Summing the heat loss and the energy use for the entire 24 hour period and then calculation that COP gave 3.73, which may be possible, but I suspect is a bit high.
The external meter kWh usage, the Midea controller Power Consumption kWh usage (both end reading minus start reading) and the cumulative hourly kWh usage from the Midea app were close but not the same: external meter 36.3kWh, Midea controller 35kWh and the summed hourly app readings 33kWh, which is getting on for 10% lower. The higher external meter reading may be either from DHW heating (the app doesn't record any DHW usage) or possibly the app only records compressor consumption, omitting pump and other usage.
The bottom line seems to be the use of estimated building heat loss as a proxy for heat input when the room temps are in steady state isn't a ludicrous idea. The derived COP is plumb in the middle of the range where we might expect it to be. The Midea app does midnight to midnight 24 hour periods, and so is not directly comparable with my midday to midday 24 hour period, but it's COP for all of yesterday was 4.1 and 4.25 for today so far, both of which seem somewhat optimistic.
All of which suggests my COP is somewhere between 3.16 and around 4.2, which I can live with. The use of automated data collection means I can continue to monitor and compare results. If I can find a way of recording the hourly flow rates and LWT and RWT (Freedom Midea app, if anyone can locate it) then I can add in the flow rate method as well, and see how that compares. I suspect it might be less reliable, as LWT and RWT temps vary continuously so an hourly read may randomly record a peak or a trough, but i suppose the errors might cancel out over time.
Midea 14kW (for now...) ASHP heating both building and DHW
Hi Everyone,
The article from Graham Hendra, posted by HughF under the '12kW Samsung gen 6' heading, has saved me from having to write reams in explanation,
@derek-m - I'm still confused by the minimum volume requirement, and how Freedom's plate heat exchanger requirement fits with that. Graham Hendra's article seems to be saying the low loss header or PHE is (was? isn't he also saying you don't need LLHs/PHEs with variable speed pumps? The pump just reduces (modulates) its flow rate) there to keep the flow rate up when the rad start to shut down, to stop the ASHP circulating pump choking itself against the increased resistance. But minimum volume (as opposed to flow rate) is separate parameter, and there is no doubt a PHE drastically reduces the circulating volume, in my case to something around 8.5L (see calcs in other thread), implying there isn't a minimum volume requirement, or if there is, it is very small.
Midea 14kW (for now...) ASHP heating both building and DHW
Posted by: @cathoderay@derek-m - I'm still confused by the minimum volume requirement, and how Freedom's plate heat exchanger requirement fits with that. Graham Hendra's article seems to be saying the low loss header or PHE is (was? isn't he also saying you don't need LLHs/PHEs with variable speed pumps? The pump just reduces (modulates) its flow rate) there to keep the flow rate up when the rad start to shut down, to stop the ASHP circulating pump choking itself against the increased resistance. But minimum volume (as opposed to flow rate) is separate parameter, and there is no doubt a PHE drastically reduces the circulating volume, in my case to something around 8.5L (see calcs in other thread), implying there isn't a minimum volume requirement, or if there is, it is very small.
To carryout a defrost cycle the heat pump requires heat energy, which in a system without a PHE it obtains from continuing to pass a volume of warm water from the heating system back to the heat pump. The return water from the heating system will still be quite warm, but instead of this water being heated by the heat pump it is now being cooled, because the heat pump is extracting heat energy to perform the defrost. This is why the system needs to have a minimum volume of water.
A system with a PHE will still perform the same function, because both the primary and secondary pumps will still be operating, but instead of the PHE transferring heat energy from the primary to the secondary, it will now be operating in reverse during the defrost cycle. The direction of water flow will not be in reverse, but the transfer of heat energy will be. The secondary system will still need to have sufficient available volume to meet the requirements of the heat pump during the defrost cycle.
The way that a defrost cycle actually functions within the heat pump, is that it reverses the refrigerant gas flow, so that the heat exchanger that was the condenser now becomes the evaporator, and the heat exchanger that was the evaporator now becomes the condenser. The normal evaporator which will have the buildup of ice will now be warmed to melt away the ice. Simples. 😎
I hope that this answer your question.
- 27 Forums
- 2,495 Topics
- 57.8 K Posts
- 260 Online
- 6,220 Members
Join Us!
Worth Watching
Latest Posts
-
RE: Setback savings - fact or fiction?
@cathoderay The input power is largely determined by...
By RobS , 31 minutes ago
-

RE: Humidity, or lack thereof... is my heat pump making rooms drier?
@editor, this is now an example of greenwashing in the ...
By Majordennisbloodnok , 42 minutes ago
-

RE: Electricity price predictions
@transparent Im impressed by all your work on this. ...
By JamesPa , 2 hours ago
-

RE: Solis inverters S6-EH1P: pros and cons and battery options
Just to wrap this up here for future readers: The S...
By Batpred , 2 hours ago
-
RE: Struggling to get CoP above 3 with 6 kw Ecodan ASHP
Welcome to the forums.I assume that you're getting the ...
By Sheriff Fatman , 3 hours ago
-

RE: What determines the SOC of a battery?
I agree. Fogstar confirmed that the Seplos BMS does ...
By Batpred , 3 hours ago
-
RE: Say hello and introduce yourself
@editor @kev1964-irl This discussion might be best had ...
By GC61 , 4 hours ago
-

RE: Testing new controls/monitoring for Midea Clone ASHP
@benson — as @tasos suggests, plotting multiple variabl...
By cathodeRay , 6 hours ago
-

@painter26 — as @jamespa says, it's for filling and re-...
By cathodeRay , 8 hours ago
-

RE: Oversized 10.5kW Grant Aerona Heat Pump on Microbore Pipes and Undersized Rads
@uknick TBH if I were taking the floor up ...
By JamesPa , 19 hours ago
-

RE: Getting ready for export with a BESS
I would have not got it if it was that tight
By Batpred , 20 hours ago
-
RE: Need help maximising COP of 3.5kW Valiant Aerotherm heat pump
@judith thanks Judith. Confirmation appreciated. The ...
By DavidB , 24 hours ago
-

RE: Recommended home battery inverters + regulatory matters - help requested
That makes sense. I thought better to comment in this t...
By Batpred , 24 hours ago
-
Bosch CS5800i 7kW replacing Greenstar Junior 28i
My heat pump journey began a couple of years ago when I...
By Slartibartfast , 1 day ago
-

RE: How to control DHW with Honeywell EvoHome on Trianco ActiveAir 5 kW ASHP
The last photo is defrost for sure (or cooling, but pre...
By JamesPa , 1 day ago
-

RE: Plug and play solar. Thoughts?
Essentially, this just needed legislation. In Germany t...
By Batpred , 1 day ago
-
RE: A Smarter Smart Controller from Homely?
@toodles Intentional opening of any warranty “can of wo...
By Papahuhu , 1 day ago
-
RE: Safety update; RCBOs supplying inverters or storage batteries
Thanks @transparent Thankyou for your advic...
By Bash , 1 day ago
-
RE: Air source heat pump roll call – what heat pump brand and model do you have?
Forum Handle: Odd_LionManufacturer: SamsungModel: Samsu...
By Odd_Lion , 1 day ago
-
RE: Configuring third party dongle for Ecodan local control
Well, it was mentioned before in the early pos...
By F1p , 2 days ago
-

RE: DIY solar upgrade - Considering adding more panels
I know this is a bit old, but it made me wonder what co...
By Batpred , 2 days ago
-

RE: New Vaillant aroTherm Plus in black - When will it come to the UK?
@majordennisbloodnok Daikin, take note! (In fact, I hav...
By Toodles , 2 days ago
-

RE: Midea ASHP – how to set weather compensation
@mk4 — good work! First, I agree, no evidence of cycl...
By cathodeRay , 2 days ago


