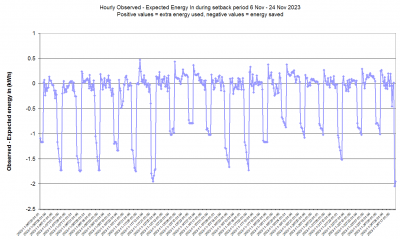
Posted by: @derek-mYou obviously misunderstood my post. The 'specified operating parameters' that James was kind enough to suggest, were that the IAT should be within 0.5C of the desired value by breakfast time, and that it should be back at the desired level prior to the next setback commencing. As I believe you previously agreed, the actual Energy In and the 'expected' Energy In values, produced by the y= formula, should be the same at this point.
I thought we were 'all agreed' that we 'all set our own comfort parameters' (desired IAT, how fast the recovery does or doesn't happen etc). The requirement to have fully recovered by the next setback, which is a necessary requirement for the analysis to be useful, is just another way of expressing a requirement for a steady average temp over the longer term, ie no net gain/loss. That requirement is met, see previous chart.
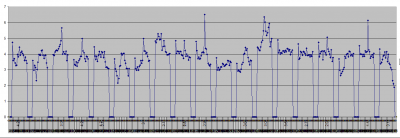
During much of the day, ie after the setback and recovery boost periods, the observed and expected values should be close, but only very rarely will they be the same, because of random variation (in part true random variation, and also very possibly other factors, but it seems very likely they behave as if random variation, ie the normality assumption). The last chart I posted shows this is indeed what happens. There is a setback, then a visible recovery boost when the observed energy use exceeds the expected, and then the two move closer together over the following hours, until the next setback. Here's the chart again, note there is random variation, what you are looking for is the dominant pattern:
Posted by: @derek-mMy concern is not that you appear to have a high tolerance to cold, but that not everyone shares this ability. You yourself had to stop using setbacks when the weather was cold, and your poorly performing heat pump could not meet the heating demand, so I would suggest a little caution in encouraging others to do the same.
As it happens, I am not very cold tolerant, that's why I stopped the setbacks during the cold spell! I don't think I have said anything even approaching encouraging others to do anything, let alone explore their tolerance to cold, and the premise of the original question (saving energy without compromising comfort) clearly does suggest comfort matters, otherwise why it it in the question/title? What I am trying to do is get a good enough answer to the original question, it is then up to others to do what they will with the answer, depending on their personal choices. I should add that a negative answer to the question is just as useful as a positive one. Knowing for example that setbacks don't save energy, or if they do, then they compromise comfort, is just as useful as knowing they can save energy without compromising comfort.
Posted by: @derek-mIf you would care to highlight the days that showed high and low extremes, I would be happy to run them through my spreadsheet, which not only takes account of variations in OAT, but also IAT, LWT, the calculated heat loss, the thermal heating capacity of the heat emitters, and the thermal mass of the building, whilst referencing the manufacturer's published data tables.
You already have the data, but it is the 'double corrected data'; here is the correct version, ie the 1.18 correction has only been applied once to the three calculated kWH_in values (calc_kWh_in (total), htg_kWh_in (space heating), dhw_kWh_in (DHW heating)). Sorting by ambient will give you the extremes, but as noted recently, they are in relative short supply, as the data collected to date is only from the end of the last heating season, and the beginning of this one. I am still collecting the data, more will become available as it collects over time.
Midea 14kW (for now...) ASHP heating both building and DHW
Posted by: @derek-mIt would appear that I am not making myself clear.
Could you please identify the day within your data when the OAT was at its lowest extreme and the day when it was at its highest extreme.
Unfortunately in the UK we do not get average daily weather, so if people are to use a setback regime, they need to know under what conditions it is likely to have a detrimental effect upon their comfort levels, and god forbid may actually be costing them more money.
We cross-posted, as I said, it's all in the zip file I have just posted, sor by ambient to get the extremes. I am not sure looking at the most extreme values will tell us much, they will almost certainly be outliers. Much better to look at the patterns in the bulk of the data.
We do and we don't have average daily weather, insofar as the average is an abstraction of what happened during a period, and does have some meaning and value, but also averages almost always hide detail. I do agree about people needing to know when their comfort levels and or wallets are threatened, that's what I asked the original question!
Midea 14kW (for now...) ASHP heating both building and DHW
Posted by: @jamespaCan you tell us what the current confidence limits are on the constant in the fit (equation reproduced below). The final outcome will be very dependent on this, as its actually the dominant factor in the equation at the fairly mild temperatures during the setback period, when the energy in is 1.2-1.5kW vs a 'constant' of 3.7.
I looked for them but could find them, such notions are beyond the simple spreadsheets I have. I am sure they can be done in python or R, but I would need to learn how to do them. I note you did get CIs for some of your estimates not so long ago, maybe you can suggest a method based on what you did?
Or can we just deal with this by using the normality assumption, ie the energy in distribution for any given OAT approximates the normal distribution, and the equation gives us the average value of that distribution for that OAT, and so will, on average, be near enough?
Midea 14kW (for now...) ASHP heating both building and DHW
Posted by: @cathoderayOr can we just deal with this by using the normality assumption, ie the energy in distribution for any given OAT approximates the normal distribution, and the equation gives us the average value of that distribution for that OAT, and so will, on average, be near enough?
As I'm sure you know the mean of a sample (which is what we are looking at) of a normally distributed population may differ from the population mean. Two samples with different means may come from the same population or not, and the level of confidence, derived in the case of a normal distribution from the standard deviation, helps us understand whether or not we have (or have not) shown that they are from different populations. I'm sure you know this!
As I say the intercept is statistically a bit of a concern as its high in relation to the other terms, so could easily distort if its not accurately determined. I suspect that your final result is actually dominated by the value of the intercept, so knowing the extent to which this can be trusted is, I am guessing, important.
I don't immediately know how to calculate the confidence levels with a polynomial fit, I will see if I can find out, it must be do-able!
4kW peak of solar PV since 2011; EV and a 1930s house which has been partially renovated to improve its efficiency. 7kW Vaillant heat pump.
Posted by: @jamespaPosted by: @cathoderayOr can we just deal with this by using the normality assumption, ie the energy in distribution for any given OAT approximates the normal distribution, and the equation gives us the average value of that distribution for that OAT, and so will, on average, be near enough?
As I'm sure you know the mean of a sample (which is what we are looking at) of a normally distributed population may differ from the population mean. Two samples with different means may come from the same population or not, and the level of confidence, derived in the case of a normal distribution from the standard deviation, helps us understand whether or not we have (or have not) shown that they are from different populations. I'm sure you know this!
As I say the intercept is statistically a bit of a concern as its high in relation to the other terms, so could easily distort if its not accurately determined. I suspect that your final result is actually dominated by the value of the intercept, so knowing the extent to which this can be trusted is, I am guessing, important.
I don't immediately know how to calculate the confidence levels with a polynomial fit, I will see if I can find out, it must be do-able!
The 'weather conditions' are the major factor affecting how an ASHP performs. Note that I use 'weather conditions' rather than OAT, since OAT is not the only factor at play.
My concern is the cause of the outliers, since I feel certain that many heat pump owners may not be too happy if they are only averagely warm during the Winter period. Rather than concentrating on proving the average compliance, it needs to be ascertained if a particular heating system can cope with the extremes when performing a setback regime, or whether in those conditions setback is to be avoided.
Posted by: @jamespaAs I'm sure you know the mean of a sample (which is what we are looking at) of a normally distributed population may differ from the population mean. Two samples with different means may come from the same population or not, and the level of confidence, derived in the case of a normal distribution from the standard deviation, helps us understand whether or not we have (or have not) shown that they are from different populations. I'm sure you know this!
I do, and I know why you are concerned about the constant's size relative to the output variable range!
Posted by: @jamespaI don't immediately know how to calculate the confidence levels with a polynomial fit, I will see if I can find out, it must be do-able!
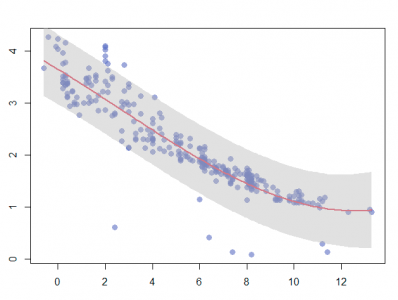
It seems like it is do-able in R. Crude plot without DHW outliers removed but with CIs shown (I think):
Midea 14kW (for now...) ASHP heating both building and DHW
Posted by: @derek-mMy concern is the cause of the outliers, since I feel certain that many heat pump owners may not be too happy if they are only averagely warm during the Winter period. Rather than concentrating on proving the average compliance, it needs to be ascertained if a particular heating system can cope with the extremes when performing a setback regime, or whether in those conditions setback is to be avoided.
I think its sadly inevitable that any conclusion is more complex that yes or no. I was (and still am) hoping that, with a combination of experiment, theory and modelling) because we cant do enough experiments, we might get to some general guidance like - setback in [insert some broad conditions] is likely to save [insert percentage) but in [insert other conditions] it may either cost money or compromise comfort too much to for many to be comfortable.
That's probably the best possible outcome from this discussion assuming we are ruling out modelling each individual house/heatpump where the owner has an interest.
4kW peak of solar PV since 2011; EV and a 1930s house which has been partially renovated to improve its efficiency. 7kW Vaillant heat pump.
Posted by: @cathoderayPosted by: @jamespaAs I'm sure you know the mean of a sample (which is what we are looking at) of a normally distributed population may differ from the population mean. Two samples with different means may come from the same population or not, and the level of confidence, derived in the case of a normal distribution from the standard deviation, helps us understand whether or not we have (or have not) shown that they are from different populations. I'm sure you know this!
I do, and I know why you are concerned about the constant's size relative to the output variable range!
Posted by: @jamespaI don't immediately know how to calculate the confidence levels with a polynomial fit, I will see if I can find out, it must be do-able!
It seems like it is do-able in R. Crude plot without DHW outliers removed but with CIs shown (I think):
-- Attachment is not available --
That's quite a big range if its right. What level of confidence is this? (incidentally I hadn't previously heard of R, but I think Ive found out how to do it in excel)
4kW peak of solar PV since 2011; EV and a 1930s house which has been partially renovated to improve its efficiency. 7kW Vaillant heat pump.
Posted by: @jamespaI think its sadly inevitable that any conclusion is more complex that yes or no. I was (and still am) hoping that, with a combination of experiment, theory and modelling) because we cant do enough experiments, we might get to some general guidance like - setback in [insert some broad conditions] is likely to save [insert percentage) but in [insert other conditions] it may either cost money or compromise comfort too much to for many to be comfortable.
That's probably the best possible outcome from this discussion assuming we are ruling out modelling each individual house/heatpump where the owner has an interest.
I think that is a very reasonable statement of aims. Set out what we do know (plus any caveats) and let folks decide for themselves.
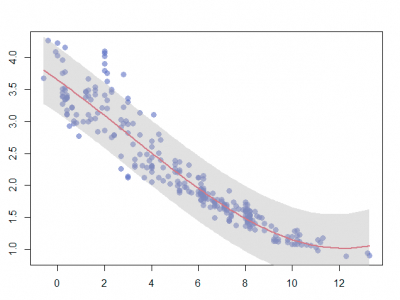
I've now got rid of the DHW hour outliers:
and think the shaded area is the CI for the line overall. I saw something somewhere about a function to get the CIs for the constituent terms of the equation.
Posted by: @jamespaThat's quite a big range if its right. What level of confidence is this? (incidentally I hadn't previously heard of R, but I think Ive found out how to do it in excel)
See above, your post appeared while I was writing this one. I presume it's the 95% CI as I'm using the defaults, and I agree it looks on the large side, and furthermore the terms don't appear to match the spreadsheet results.
More hours ahead of endless fun in R... If it can be done in a spreadsheet, probably so much the better.
Midea 14kW (for now...) ASHP heating both building and DHW
Posted by: @cathoderayPosted by: @jamespaI think its sadly inevitable that any conclusion is more complex that yes or no. I was (and still am) hoping that, with a combination of experiment, theory and modelling) because we cant do enough experiments, we might get to some general guidance like - setback in [insert some broad conditions] is likely to save [insert percentage) but in [insert other conditions] it may either cost money or compromise comfort too much to for many to be comfortable.
That's probably the best possible outcome from this discussion assuming we are ruling out modelling each individual house/heatpump where the owner has an interest.
I think that is a very reasonable statement of aims. Set out what we do know (plus any caveats) and let folks decide for themselves.
I've now got rid of the DHW hour outliers:
-- Attachment is not available --
and think the shaded area is the CI for the line overall. I saw something somewhere about a function to get the CIs for the constituent terms of the equation.
Posted by: @jamespaThat's quite a big range if its right. What level of confidence is this? (incidentally I hadn't previously heard of R, but I think Ive found out how to do it in excel)
See above, your post appeared while I was writing this one. I presume it's the 95% CI as I'm using the defaults, and I agree it looks on the large side, and furthermore the terms don't appear to match the spreadsheet results.
More hours ahead of endless fun in R... If it can be done in a spreadsheet, probably so much the better.
Here is what excel says
'X Variable 1' is ambient squared
'X Variable 2' is ambient
95% confidence on the intercept is 3.59-3.8, so basically +/-100W, ie 2.4kWh/day.
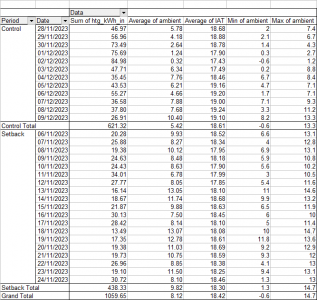
Here is a pivot on the data answering some other questions (I haven't excluded the DHW outliers so the total energy is is a little larger)
4kW peak of solar PV since 2011; EV and a 1930s house which has been partially renovated to improve its efficiency. 7kW Vaillant heat pump.
OK so here are some observations to ponder, in no particular order, and with no particular agenda (other than to try to explain the observations)
- If we believe the excel regression analysis figures then the observed difference, whilst it may be wrong, is, so far as I can tell, statistically significant.
- The average reduction appears to be about 7kWh/day as previously stated by @cathoderay
- The Ambient during the setback period was generally higher and less variable than during the control period
- The house seems to cool by about 2C for about 9hrs at an IAT around 19 and ambient around 10. So the reduction in heat lost from the house accounts for a saving in energy supplied to the house of about 4% (1/10*9/24) only, about 1.2kW => something else is going on
- In the hour immediately after setback (when the recovery is presumably happening) the COP is actually rather high even though its 4am in the morning. Whats going on here? It then drops, creeps back up during the day (as one would expect) then drops again (see plot below). Is this significant?
- The circulation pump(s) is (are?) (presumably) off for 6 hrs. Assuming three are 2 and they are both 50W pump thats only about 0.5kWh, so thats not accounting for the discrepancy
- We know (because @cathoderay has mentioned it) that this particular heat pump in this particular setup has a tendency to cycle at modest temperatures. I cant be sure whether its cycling or not on the days of interest (or on the control days, or more to point the control days when the temp is mild). Is this relevant?
Basically I'm currently struggling to explain the observations which cant, so far as I can see, be explained by savings in heat lost from the house. However there must be an explanation which is consistent with the laws of physics.
4kW peak of solar PV since 2011; EV and a 1930s house which has been partially renovated to improve its efficiency. 7kW Vaillant heat pump.
- 27 Forums
- 2,495 Topics
- 57.8 K Posts
- 582 Online
- 6,220 Members
Join Us!
Worth Watching
Latest Posts
-

RE: Humidity, or lack thereof... is my heat pump making rooms drier?
That’s my pleasure, @andrewj. The only challenge now is...
By Majordennisbloodnok , 2 hours ago
-
RE: Electricity price predictions
@toodles @skd Then there is not going to be much from t...
By ChandyKris , 2 hours ago
-
RE: Solis inverters S6-EH1P: pros and cons and battery options
@batpred I reckon Andy might know a thing or 2 about...
By Bash , 3 hours ago
-
RE: What determines the SOC of a battery?
@batpred Ironically you didn't have anything good to...
By Bash , 4 hours ago
-
RE: Testing new controls/monitoring for Midea Clone ASHP
Here’s a current graph showing a bit more info. The set...
By benson , 4 hours ago
-
RE: Setback savings - fact or fiction?
True there is a variation but importantly it's understa...
By RobS , 4 hours ago
-

Below is a better quality image. Does that contain all ...
By trebor12345 , 4 hours ago
-
Sorry to bounce your thread. To put to bed some concern...
By L8Again , 4 hours ago
-

@painter26 — they (the analogue gauges) are subtly diff...
By cathodeRay , 5 hours ago
-
Our Experience installing a heat pump into a Grade 2 Listed stone house
First want to thank everybody who has contributed to th...
By Travellingwave , 9 hours ago
-
RE: Struggling to get CoP above 3 with 6 kw Ecodan ASHP
Welcome to the forums.I assume that you're getting the ...
By Sheriff Fatman , 12 hours ago
-
RE: Say hello and introduce yourself
@editor @kev1964-irl This discussion might be best had ...
By GC61 , 13 hours ago
-

RE: Oversized 10.5kW Grant Aerona Heat Pump on Microbore Pipes and Undersized Rads
@uknick TBH if I were taking the floor up ...
By JamesPa , 1 day ago
-

RE: Getting ready for export with a BESS
I would have not got it if it was that tight
By Batpred , 1 day ago
-
RE: Need help maximising COP of 3.5kW Valiant Aerotherm heat pump
@judith thanks Judith. Confirmation appreciated. The ...
By DavidB , 1 day ago
-

RE: Recommended home battery inverters + regulatory matters - help requested
That makes sense. I thought better to comment in this t...
By Batpred , 1 day ago
-
Bosch CS5800i 7kW replacing Greenstar Junior 28i
My heat pump journey began a couple of years ago when I...
By Slartibartfast , 1 day ago
-

RE: How to control DHW with Honeywell EvoHome on Trianco ActiveAir 5 kW ASHP
The last photo is defrost for sure (or cooling, but pre...
By JamesPa , 1 day ago
-

RE: Plug and play solar. Thoughts?
Essentially, this just needed legislation. In Germany t...
By Batpred , 1 day ago
-
RE: A Smarter Smart Controller from Homely?
@toodles Intentional opening of any warranty “can of wo...
By Papahuhu , 2 days ago
-
RE: Safety update; RCBOs supplying inverters or storage batteries
Thanks @transparent Thankyou for your advic...
By Bash , 2 days ago
-
RE: Air source heat pump roll call – what heat pump brand and model do you have?
Forum Handle: Odd_LionManufacturer: SamsungModel: Samsu...
By Odd_Lion , 2 days ago
-
RE: Configuring third party dongle for Ecodan local control
Well, it was mentioned before in the early pos...
By F1p , 2 days ago

