Posted by: @morganWhy am I getting email notifications that I have been mentioned in a thread when I clearly haven't and neither am I subscribed to said thread? Confused.
"You have been mentioned in a post on "Do setbacks save energy without compromising comfort?" by JamesPa."
"You have been mentioned in a post on "Do setbacks save energy without compromising comfort?" by newhouse87."
You're probably subscribed to all Air Source Heat Pump posts. You can unsubscribe from your profile/setting page.
Get a copy of The Ultimate Guide to Heat Pumps
Subscribe and follow our YouTube channel!
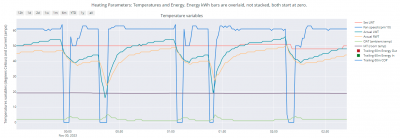
Well well, here's the definitive answer as to whether Midea heat pumps run the fan during defrosts (apologies for not editing the titles etc, this is just a quick and dirty plot to get the answer, and note the fan speed in royal blue is RPM/10 to get it to scale with the other parameters):
There are two clear defrost cycles, one shortly before 0030 and one shortly before 0130, and during both the fan RPM drops to zero. It also drops to zero during the other three LWT over-shoot cycles.
Midea 14kW (for now...) ASHP heating both building and DHW
Posted by: @editorPosted by: @morganWhy am I getting email notifications that I have been mentioned in a thread when I clearly haven't and neither am I subscribed to said thread? Confused.
"You have been mentioned in a post on "Do setbacks save energy without compromising comfort?" by JamesPa."
"You have been mentioned in a post on "Do setbacks save energy without compromising comfort?" by newhouse87."
You're probably subscribed to all Air Source Heat Pump posts. You can unsubscribe from your profile/setting page.
I haven't and this is a recent issue. I deliberately untick the subscribe box on each post I make.
Retrofitted 11.2kw Mitsubishi Ecodan to new radiators commissioned November 2021.
14 x 500w Monocrystalline solar panels.
2 ESS Smile G3 10.1 batteries.
ESS Smile G3 5kw inverter.
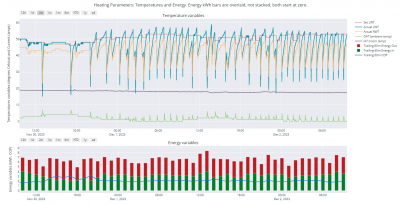
A sorry sight for sore eyes - the last 48 hours data:
Dominated by defrost cycles, appalling COPs and a slight but steady decline in IAT - heat pump CQC (can't quite cope - in these conditions the inherent decline in output plus the deleterious effects of the defrost cycles means the heat pump can't match the demand, and the IAT steadily edges downwards). Even the period of relatively steady running on the left hand side offers little comfort, the COP is still dreadful apart from a slight improvement in mid afternoon.
Midea 14kW (for now...) ASHP heating both building and DHW
Speaking of defrosts. Anybody know how check defrost settings on daikin altherma low temp split 2. 1 frost stat left setting from factory incorrectly which i only got clarification on last spring so id like check this. Never have ice build up on unit but seems be defrosting way too frequently for my liking in 4 and below temps.
Do setbacks save energy without compromising comfort? The original question...
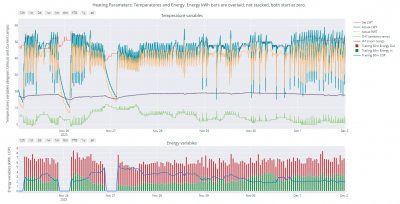
Given the above chart edit: this is not the image I meant, see below for the correct one , I thought it might be interesting to look at 24h noon to noon energy in values for two periods that are not that dissimilar, except for the fact one had a setback, and the other didn't, the 24h to noon on the 26 Nov, and the 24h to noon on 1 Dec. The former had an average OAT of 2.5, the latter and average OAT of 1.9, and both spent most of the time between 4 degrees and zero. Overall, the second period was colder, but not by a lot. The average IAT was a degree or so higher in the second period, but both saw a fall in the IAT over the period by about one degree (heat pump CQC). I also added the calculated vs meter reading discrepancy correction factor between the two periods (on 29 Nov), and as a result the later period kWh values are multiplied by 1.18. I haven't yet got round to adjusting all the historical values, as it needs careful planning if I am not to screw up my data. With all those caveats out of the way, here are the results:
Total past 24h kWh in to noon on 26 Nov: 48.25
Total past 24h kWh in to noon on 1 Dec: 70.04
Now, that is quite some difference. What could explain it?
Midea 14kW (for now...) ASHP heating both building and DHW
Posted by: @cathoderayDo setbacks save energy without compromising comfort? The original question...
Given the above chart, I thought it might be interesting to look at 24h noon to noon energy in values for two periods that are not that dissimilar, except for the fact one had a setback, and the other didn't, the 24h to noon on the 26 Nov, and the 24h to noon on 1 Dec. The former had an average OAT of 2.5, the latter and average OAT of 1.9, and both spent most of the time between 4 degrees and zero. Overall, the second period was colder, but not by a lot. The average IAT was a degree or so higher in the second period, but both saw a fall in the IAT over the period by about one degree (heat pump CQC). I also added the calculated vs meter reading discrepancy correction factor between the two periods (on 29 Nov), and as a result the later period kWh values are multiplied by 1.18. I haven't yet got round to adjusting all the historical values, as it needs careful planning if I am not to screw up my data. With all those caveats out of the way, here are the results:
Total past 24h kWh in to noon on 26 Nov: 48.25
Total past 24h kWh in to noon on 1 Dec: 70.04
Now, that is quite some difference. What could explain it?
It would be interesting to answer this. Can you post the two graphs you are comparing and also the previous 24hrs on each case?
4kW peak of solar PV since 2011; EV and a 1930s house which has been partially renovated to improve its efficiency. 7kW Vaillant heat pump.
Posted by: @jamespaCan you post the two graphs you are comparing and also the previous 24hrs on each case?
The chart was in my previous post two above the last one, but the website pagination has put it on a previous page. Here it is again:
edit: this is not the correct image, see below for the correct one
And here are the caveats and the two 24 energy in figures:
Given the above chart, I thought it might be interesting to look at 24h noon to noon energy in values for two periods that are not that dissimilar, except for the fact one had a setback, and the other didn't, the 24h to noon on the 26 Nov, and the 24h to noon on 1 Dec. The former had an average OAT of 2.5, the latter and average OAT of 1.9, and both spent most of the time between 4 degrees and zero. Overall, the second period was colder, but not by a lot. The average IAT was a degree or so higher in the second period, but both saw a fall in the IAT over the period by about one degree (heat pump CQC). I also added the calculated vs meter reading discrepancy correction factor between the two periods (on 29 Nov), and as a result the later period kWh values are multiplied by 1.18. I haven't yet got round to adjusting all the historical values, as it needs careful planning if I am not to screw up my data. With all those caveats out of the way, here are the results:
Total past 24h kWh in to noon on 26 Nov: 48.25
Total past 24h kWh in to noon on 1 Dec: 70.04
Now, that is quite some difference. What could explain it?
Edit: methodology note: the 24 hour totals aren't on the chart per se, they are in a file called midea_24h_data.csv, and the wonderful q.exe Text as Data program can retrieve them in a fraction of a second:
..\q-text-as-data-3_1_6>q -H -d , "select datetime, amb_24h_mean, htg_24h_kWh_in, tot_24h_kWh_in from midea_24h_data.csv where datetime like '%T12%' order by datetime desc limit 20"
2023-12-01T12:01:00,1.9,70.04,70.04
2023-11-30T12:01:01,3.4,67.86,69.641
2023-11-29T12:01:01,4.4,48.134,49.732
2023-11-28T12:01:01,6.6,37.147,37.147
2023-11-27T12:01:00,9.2,23.849,24.989
2023-11-26T12:01:00,2.5,48.245,48.245
2023-11-25T12:01:00,3.9,41.23,42.144
2023-11-24T12:01:00,11.2,17.283,18.82
2023-11-23T12:01:00,11.0,17.182,17.182
2023-11-22T12:01:01,8.5,22.721,23.802
2023-11-21T12:01:00,11.3,16.01,17.136
2023-11-20T12:01:01,11.6,15.724,16.808
2023-11-19T12:01:00,13.4,12.515,13.516
2023-11-18T12:01:01,10.9,16.312,17.378
2023-11-17T12:01:01,7.4,26.595,26.595
2023-11-16T12:01:00,8.1,22.845,24.42
2023-11-15T12:01:00,10.5,17.09,18.254
This query selects the data from the listed columns from the csv file, where the datetime column has the string 'T12' within it (ie noon), and by ordering as descending and returning only the last 20, it gets the 20 most recent records. Very neat!
Midea 14kW (for now...) ASHP heating both building and DHW
Posted by: @cathoderayDo setbacks save energy without compromising comfort? The original question...
Given the above chart, I thought it might be interesting to look at 24h noon to noon energy in values for two periods that are not that dissimilar, except for the fact one had a setback, and the other didn't, the 24h to noon on the 26 Nov, and the 24h to noon on 1 Dec. The former had an average OAT of 2.5, the latter and average OAT of 1.9, and both spent most of the time between 4 degrees and zero. Overall, the second period was colder, but not by a lot. The average IAT was a degree or so higher in the second period, but both saw a fall in the IAT over the period by about one degree (heat pump CQC). I also added the calculated vs meter reading discrepancy correction factor between the two periods (on 29 Nov), and as a result the later period kWh values are multiplied by 1.18. I haven't yet got round to adjusting all the historical values, as it needs careful planning if I am not to screw up my data. With all those caveats out of the way, here are the results:
Total past 24h kWh in to noon on 26 Nov: 48.25
Total past 24h kWh in to noon on 1 Dec: 70.04
Now, that is quite some difference. What could explain it?
I would suspect that it would be very difficult if not impossible to fully explain the difference without looking closely at the underlying raw data, and all the other parameters, which when combined, affect how a heating system operates and performs.
The main reduction in energy consumption is achieved by allowing a lowering of the IAT, which of course then has an impact on comfort levels.
Sorry if you were confused, it is entirely my fault, I was looking at one image (last week) and had posted another (last 48 hours). The last week looks like this, with the two not dissimilar 26 Nov and 1 Dec periods:
Midea 14kW (for now...) ASHP heating both building and DHW
Posted by: @derek-mI would suspect that it would be very difficult if not impossible to fully explain the difference without looking closely at the underlying raw data, and all the other parameters, which when combined, affect how a heating system operates and performs.
The main reduction in energy consumption is achieved by allowing a lowering of the IAT, which of course then has an impact on comfort levels.
I do have the data, as you know, all you have to do is ask!
According to my Mark 1 Eyeball Aggregator, the IAT was on average about one degree less in the first period, but using the 10% saving for one degree drop in IAT rule of thumb, that will only account for between 5-7 kWh of difference in energy in. The house is running a bit cold (and comfort is impaired) at the moment but that is down to the OAT, and the heat pump being in CQC (can't quite cope) mode. However, the question is about energy use differences between two not too dissimilar 24 hour periods.
Midea 14kW (for now...) ASHP heating both building and DHW
Posted by: @cathoderayPosted by: @derek-mI would suspect that it would be very difficult if not impossible to fully explain the difference without looking closely at the underlying raw data, and all the other parameters, which when combined, affect how a heating system operates and performs.
The main reduction in energy consumption is achieved by allowing a lowering of the IAT, which of course then has an impact on comfort levels.
I do have the data, as you know, all you have to do is ask!
According to my Mark 1 Eyeball Aggregator, the IAT was on average about one degree less in the first period, but using the 10% saving for one degree drop in IAT rule of thumb, that will only account for between 5-7 kWh of difference in energy in. The house is running a bit cold (and comfort is impaired) at the moment but that is down to the OAT, and the heat pump being in CQC (can't quite cope) mode. However, the question is about energy use differences between two not too dissimilar 24 hour periods.
Thats almost certainly a part of it. What I also suspect is that the previous 24hrs matters a lot, and so far as I can tell from the graphs the OAT was falling prior to 26th Nov, but fairly constant (and low) prior to 1 Dec. If this is the case then another significant difference will be the heat given up from the fabric in the first case (as the gradient across the fabric changes) but not in the second case.
Can you post the actual data in a usable form for 48rs before and 24hrs after each day of interest (and of course also for the day itself) and the calculation you did to get to the figures. It would be instructive to analyse it in a couple of ways that's really not possible with a Mk1 eyeball integrator, but fairly easy in excel.
My interest is this. If we cant explain, at least to within 10-20%, a difference as large as this what hope is there of actually measuring a setback saving of 5% or less without some fairly fancy data processing.
4kW peak of solar PV since 2011; EV and a 1930s house which has been partially renovated to improve its efficiency. 7kW Vaillant heat pump.
- 27 Forums
- 2,495 Topics
- 57.8 K Posts
- 407 Online
- 6,220 Members
Join Us!
Worth Watching
Latest Posts
-
RE: Solis inverters S6-EH1P: pros and cons and battery options
Just to provide some alternative feedback to balance th...
By Bash , 1 minute ago
-
RE: What determines the SOC of a battery?
@batpred Ironically you didn't have anything good to...
By Bash , 9 minutes ago
-
RE: Testing new controls/monitoring for Midea Clone ASHP
Here’s a current graph showing a bit more info. The set...
By benson , 23 minutes ago
-
RE: Setback savings - fact or fiction?
True there is a variation but importantly it's understa...
By RobS , 23 minutes ago
-

Below is a better quality image. Does that contain all ...
By trebor12345 , 49 minutes ago
-
Sorry to bounce your thread. To put to bed some concern...
By L8Again , 51 minutes ago
-

@painter26 — they (the analogue gauges) are subtly diff...
By cathodeRay , 1 hour ago
-

RE: Electricity price predictions
I am always impressed with how you keep abreast of so m...
By Batpred , 2 hours ago
-
RE: Humidity, or lack thereof... is my heat pump making rooms drier?
@majordennisbloodnok I’m glad I posted this. There see...
By AndrewJ , 2 hours ago
-
Our Experience installing a heat pump into a Grade 2 Listed stone house
First want to thank everybody who has contributed to th...
By Travellingwave , 5 hours ago
-
RE: Struggling to get CoP above 3 with 6 kw Ecodan ASHP
Welcome to the forums.I assume that you're getting the ...
By Sheriff Fatman , 8 hours ago
-
RE: Say hello and introduce yourself
@editor @kev1964-irl This discussion might be best had ...
By GC61 , 10 hours ago
-

RE: Oversized 10.5kW Grant Aerona Heat Pump on Microbore Pipes and Undersized Rads
@uknick TBH if I were taking the floor up ...
By JamesPa , 24 hours ago
-

RE: Getting ready for export with a BESS
I would have not got it if it was that tight
By Batpred , 1 day ago
-
RE: Need help maximising COP of 3.5kW Valiant Aerotherm heat pump
@judith thanks Judith. Confirmation appreciated. The ...
By DavidB , 1 day ago
-

RE: Recommended home battery inverters + regulatory matters - help requested
That makes sense. I thought better to comment in this t...
By Batpred , 1 day ago
-
Bosch CS5800i 7kW replacing Greenstar Junior 28i
My heat pump journey began a couple of years ago when I...
By Slartibartfast , 1 day ago
-

RE: How to control DHW with Honeywell EvoHome on Trianco ActiveAir 5 kW ASHP
The last photo is defrost for sure (or cooling, but pre...
By JamesPa , 1 day ago
-

RE: Plug and play solar. Thoughts?
Essentially, this just needed legislation. In Germany t...
By Batpred , 1 day ago
-
RE: A Smarter Smart Controller from Homely?
@toodles Intentional opening of any warranty “can of wo...
By Papahuhu , 1 day ago
-
RE: Safety update; RCBOs supplying inverters or storage batteries
Thanks @transparent Thankyou for your advic...
By Bash , 1 day ago
-
RE: Air source heat pump roll call – what heat pump brand and model do you have?
Forum Handle: Odd_LionManufacturer: SamsungModel: Samsu...
By Odd_Lion , 1 day ago
-
RE: Configuring third party dongle for Ecodan local control
Well, it was mentioned before in the early pos...
By F1p , 2 days ago


