Posted by: @cathoderayAs you can see, the IAT is not recovering, it remains at 16.5, 2.5 degrees below the desired IAT. The OAT has dropped, defrost cycles have reappeared, and the COP is heading for the not so bargain basement.
For example, at 0800 this morning, OAT -4, it has used just under 5 kWh in the last hour, and put out just over 8 kWh (bear in mind that is the total for the hour, at various times during the hour the actual use might vary). This is the mystery - why is it no where near 11 (what the data tables say can/should produce)? Is this the real penalty of defrost cycles showing its ugly head?
Not sure what the capability of a PHE is - efficiency? In any event, I don't know, because it is quite literally a black box supplied by Freedom with no identification of model on it itself, or in the paperwork.
Again, I get the idea, and others have also suggested the same thing, but I am still hung up on the fact the fundamental problem is the heat pump is under-powered, and, to reverse the usual order, you can't get a quart out of a pint pot. Or am I missing something? The fans will transfer more heat from the rad to the room, RWT will drop, and the heat pump will have to work harder (ie use more energy) to get the cooler RWT back up to LWT, thereby delivering more heat to the room?
are you sure that it is the HP is underpowered? or is it that your system design doesn't allow the maximum power of the heat pump to be utilised? does it ever show more than 8kw on the output?
defrost can be around 10-15% but you should be able to clearly see that in the data, with your modbus polling frequently and flow rate you should clearly see a short period during the defrost cycle (just 3 or 4 minutes) when energy transfer is negative as LWT goes lower than RWT. It's therefore valid to subtract that from the positive generated amount and show the net, but its also valid (and more useful) to calculate and show both independently.
I didn't know much about PHE's until about an hour ago but I've just spent some time RTFM'ing. I found this to be a good primer. In short , the thing that matters is surface area (number of plates times size of plate) If not enough, then it can't move heat fast enough . Also its ability to move heat drops enormously the lower the temp and lower the DT. So, for a heat pump application, at low DT and low temperatures, they need to be massively oversized, vs any capacity number printed on it which will be one for industrial processes with very high temperatures. So this is nominally 450kw but actually about right for a low temp 12kw heat pump with glycol in the system . Its not cheap. If your PHE is literally a black box with no markings, thats a concern - its possible that its underspecced, and that could be the reason you can't get enough heat through your system - the PHE could be a choke point.
What the rad fans do is increase your effective emitter area so you can run with a lower LWT for the same heat output and thus get a better COP. Or get more heat output for the same LWT and thus a warmer room. BUT this approach will only work in your system (I am trying to help you with your "can't fit bigger rads" situation) if there is not another choke point. I'm wary of your PHE to be honest.
Is the black box just a cover?
My octopus signup link https://share.octopus.energy/ebony-deer-230
210m2 house, Samsung 16kw Gen6 ASHP Self installed: Single circulation loop , PWM modulating pump.
My public ASHP stats: https://heatpumpmonitor.org/system/view?id=45
11.9kWp of PV
41kWh of Battery storage (3x Powerwall 2)
2x BEVs
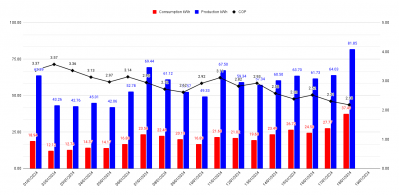
Posted by: @hughfHow is everyone’s system performing in this current cold snap?
Just curious to see if everyone is happy with their comfort and running costs, given that we are now well into ‘design conditions’ for the heat loss calcs.
We live in an end terrace 200+ yr old solid stone walled cottage with a single storey north facing offshot kitchen, which is the hardest room to heat. Contrary to accepted practice, we only run the 12kW Samsung from 04:00 to 07:30, 13:00-16:00 and 20:00 to 21:30 in order to minimise costs. The kitchen warms to 17-18 deg C by breakfast time and the living room is around 18-19 deg C. The bathroom is toasty. The downside is the cooler kitchen late morning and evening, but we wear layers and are out and about during the day or using the living room anyway. We also have the luxury of a log burner in the living room from 17:00 to 19:30. This practice means our LWT is probably 4-5 deg C higher than it would be if we ran it 24/7 and so COP is lower, but I reckon it is still the cheaper option. DHW is heated from 21:30 to 22:00.
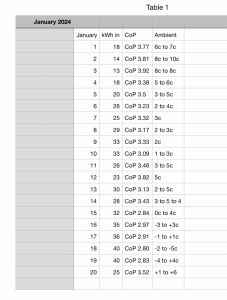
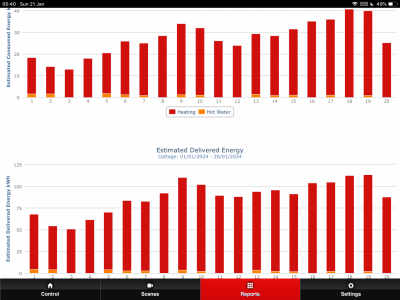
The graph shows our ASHP consumption and production in January. If anything, the house was warmer by breakfast time during the cold snap, than in the milder weather. Weather compensation LWT 45 degC at -5 degC OAT and 25 degC at 15 degC OAT. However, the LWT Offset on the Samsung is +3, so LWT got close to 50 degC when the OAT fell to -5 degC. We are on Octopus Agile, which has been very reasonably priced and consequently, it has been cheaper to run the ASHP than a gas boiler, even during the cold snap. The most we have paid per day is £6.08 on 18th January, when the ASHP stayed on all morning.
Posted by: @iancalderbankRadiators - you can get good results on boosting underpowered rads by installing fans. I've mounted an array of 90mm 12V PC fans underneath a K2. A K3 should be able to take wider ones. with a variable speed controller they can be silent or near-silent.
Ian, would you be able to provide some photos and instructions on how to do something similar? The only DIY radiator fans that I have come across were situated above the radiators ( https://originaltwist.com/2018/11/14/diy-fan-coil-heater/). I would hope that these may help to prevent short cycling, when radiators cannot deliver the minimum ASHP output at lower LWTs.
Posted by: @iancalderbankare you sure that it is the HP is underpowered? or is it that your system design doesn't allow the maximum power of the heat pump to be utilised? does it ever show more than 8kw on the output?
Yes, I am sure as can be. It is down to simple numbers. The calculated heat loss at -2 is 12.4 kW, a figure that I think is as good an estimate as can be made given the fact all heat loss calculations make a lot of assumptions. Midea claim my heat pump outputs around 11.3 kW at around 0 degrees OAT with a design LWT of 55. The building loss is greater than the heat the heat pump can supply, ergo the heat pump is underpowered. It only passed the MCS requirements because at design time we thought, based on the Freedom spreadsheet, that the heat pump had a higher output, of 12.4 kW. In reality, it is an MCS fail, but no one knew it at the time. That said, and back in the real world away from MCS lunacy, as the OAT rises, the heat loss drops, and the heat pump output increases, so the heat pump gets to the point where it can match the demand, ie the heat pump is only underpowered at low OATs, at moderate and higher OATs it can match the demand and the house heats up just fine.
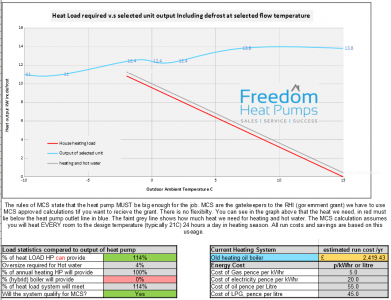
Incidentally, here is the actual spreadsheet as submitted to MCS at installation time. Piling Pelion on Ossa, it contained a typo on the heat loss worksheet, the kitchen external wall area that should have been 12.3 was entered as 2.3, and so the total heat loss is wrong. It shows a clear MCS pass. Note the blue line, the Midea 14kW unit output. There is a 'defrost dip' at around zero degrees OAT, but it is nowhere near 10-15%, and the output at around that point is clearly shown as 12.4, which we now know, from the Midea data tables, not to mention my modbus data, is over-optimistic:
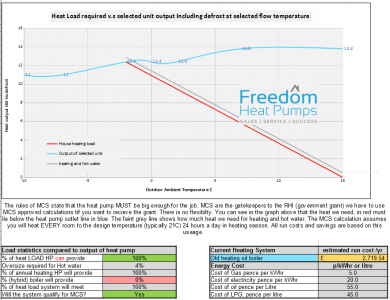
Here is the same worksheet, with the typo corrected. The total heat loss is now 12.4 kW, exactly matching the claimed, but incorrect, heat pump output. It is an MCS pass, but with zero margin:
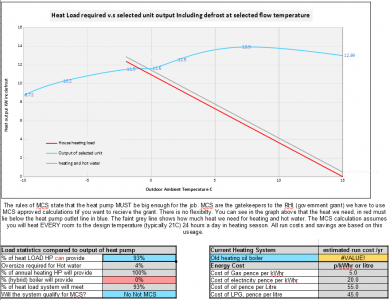
Finally, here is an unlocked copy of the worksheet, edited to use more realistic Midea output values from the Midea Engineering Data tables. As you can see, it is a clear MCS fail:
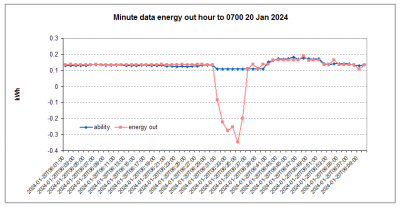
The minute data on energy out is interesting. I had forgotten I included the 'ability' which is the 'capacity' ie the moment by moment power (kW) output in the modbus data collection, in addition to the data I collect and use to determine the calculated energy (kWh) output, LWT, RWT and flow rate. Let's consider the hour up to 0700 this morning, which had one defrost cycle which started at 0631 and was over by 0650 ie it had an impact on output for 20 of the 60 minutes in the hour. OAT as measured by the heat pump was steady at 4 degrees C, apart from the 10 minute peaking at 7 degrees C spike caused by the defrost.
First, let us consider the energy out hour totals. My calculated total for the hour is 6.219 kWh, the Midea 'ability' total is 8.078 kWh, and the Midea total lifetime energy out based value, which only records in integers, is 7 kWh. Something is not quite right here. Let's look at the minute by minute data. This should be a bar chart, but is easier to read as a line chart; 'ability' is the Midea 'capacity' ie momentary output, 'energy out' is my calculated energy out:
Well well, well, what have we here? Do I smell a whiff of compressor-gate in the air? It seems the Midea values ignore the defrost. During the defrost, the heat thief in my heat pump steals heat from my house to do the defrost, but Midea claims it never happened! Nothing to see here! The heat pump just keeps on rolling on. As has been said, I could not stop it if I wished; no one can stop it. Like the Mississippi, it just keeps rolling along. Let it roll. Let it roll on full flood, inexorable, irresistible... only it isn't true. The duration of the period of heat thievery (ie negative values) is six minutes, or 10% of the total hour, but of course the LWT has to recover after the thief has gone, meaning the total impact on heat transfer is much longer, about 20 minutes, or 33% of the total hour.
Lastly, there is something else interesting in the 'ability' data that is less evident on the chart. Although the total for the hour is 8.078 kWh, the minute by minute power values (given in kW on the wired controller/in the modbus data, which then need to be divided by 60 to get the hourly totals) vary minute by minute, ranging from 6.51 to 10.93 kW. It seems the heat pump can briefly up its output to something approaching the 'norm' capacity in the tables (tables LWT 50, OAT 5, norm = 10.50 kW; actuals LWT 48, OAT 4, peak = 10.93 kW), but most of the time falls short. That compressor-gate smell is getting stronger...
Posted by: @iancalderbankIs the black box just a cover?
Yes, it is a black foam insulation jacket stuck tight to the inner metal box. The brand is 'Seccespol' from a label on the black foam, no other visible marking, and the manufacturers were unable to derive the model from the dimensions because I can't measure the inner box as it is jammed between floor boards and the base of the DHW tank. At the time, Freedom were operating in their we don't talk to end users mode, meaning I couldn't ask them. Very roughly, and with a bit of guess work, it is about 450 x 80 x 80mm - ie much smaller than the PHE you link to in yout post. It may be a black box on the outside, but I suspect there is a red face on the inside.
The system has yet to recover from yesterday's lower LWT period, the current actual IAT being only 17.3 despite setting resetting the left hand end of the WCC baseline back to 56 degrees yesterday evening. I'm hoping today's possibly slightly milder weather may keep the heat pump out of defrost territory, and allow the system to get back to where it should be, 19 degrees OAT. Once it gets there, I'll take another set of temp readings from the PHE, but in the longer term I suspect I will come round to the idea it has to go.
Midea 14kW (for now...) ASHP heating both building and DHW
@cathoderay its not "compressor gate" that is how they all calculate it. The energy generated was 8kwh, thats what the heat pump will report. But the system overall lost about 1.8kwh due to defrost. Both numbers are valid. 1.8kwh is rather high as a percentage loss but that doesn't make it wrong for the heat pumps data not to subtract it. As the system owner its up to you to subtract it in terms of working out your performance
what really stands out is that apart from very brief periods you're never getting close to the peak output of the heat pump that you've got
That means that the "1st priority" problem is NOT that the heat pump doesn't have enough capacity. we can discuss the heat pumps capacity graph till the cows come home but it won't help.
the 1st priority problem is that the rest of the system doesn't have enough throughput. If your heat pump was running flat out all day at 11kw and your house still wasn't quite warm enough, then that would mean something different - but its not. the minute by minute data looks like about 0.13kwh per min , which equals 8kw ?
very very likely the PHE is undersized and is acting as a choke point of roughly 8kw on your system. ( unless there are also undercapacity elements in the radiators and/or the pipework as well)
are you able to find out what bill of materials from freedom was supplied to your property / installer? partcode for the PHE is what I'm driving at.
My octopus signup link https://share.octopus.energy/ebony-deer-230
210m2 house, Samsung 16kw Gen6 ASHP Self installed: Single circulation loop , PWM modulating pump.
My public ASHP stats: https://heatpumpmonitor.org/system/view?id=45
11.9kWp of PV
41kWh of Battery storage (3x Powerwall 2)
2x BEVs
Posted by: @iancalderbankThe energy generated was 8kwh, thats what the heat pump will report.
Sorry, but I want to be clear about this in my own mind. I think it may be all about what happens during the defrost, and how you account for it (in an accounting sense). Surely the heat pump doesn't generate heat energy during the defrost, it can't as the compressor is operating in reverse. Instead, it sucks back some previously generated banked heat that is stored in the house. In that sense, the negative values shouldn't be included in the account, because the negative values remove energy that was generated. But if I remove the negative values, leaving just energy that was generated, the total still comes to less, 7.587 kWh. Furthermore, during the defrost, the amps in drop from routinely over 10 amps in to 2,3,2,2, 6,5 amps, and if the amps, and so watts, in drops that much, then the watts out must drop by a similar amount, but they don't, the Midea 'ability' (capacity, kW) stays at a suspiciously constant at 6.51 kW for ten whole minutes, six in the defrost, four after, when normally it varies minute by minute. Very few amps in, rock steady kW out, doesn't look right to me.
I am not sure it is up to me as the system owner to work out these things. I (and you) have chosen to look more deeply into these things, but the average Midea heat pump owner looking at their wired controller is going to see the figures as presented by Midea, and the net output is not what is presented, for example the wired controller claims the heat pump is producing heat output during the defrost, when it clearly isn't, and can't be. Furthermore, it is of course the net heat produced that actually matters. It is no good saying saying heat pump delivered 8 kWh, and then omitting to mention that it clawed back 1.8 kWh to do the defrost. It is at best misleading.
Posted by: @iancalderbankthe 1st priority problem is that the rest of the system doesn't have enough throughput. If your heat pump was running flat out all day at 11kw and your house still wasn't quite warm enough, then that would mean something different - but its not. the minute by minute data looks like about 0.13kwh per min, which equals 8kw ?
very very likely the PHE is undersized and is acting as a choke point of roughly 8kw on your system. ( unless there are also undercapacity elements in the radiators and/or the pipework as well)
are you able to find out from freedom what bill of materials was supplied to your property / installer? partcode for the PHE is what I'm driving at.
Its about 0.13kWh when running in heating mode, which it did for 54 minutes, giving a total of 7.02kWh for the hour (the actual sum is the earlier quoted 7.587 kWh); neither is 8 kWh.
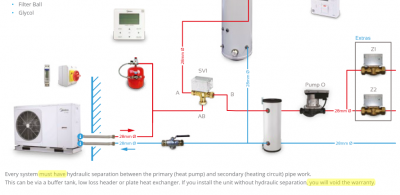
I do agree that by far the most likely problem is the PHE, which throttles the throughput. I do vaguely recall (remember this all happened very early on, when I had far less understanding) a conversation with my installer about sizing of the PHE, and I think I recall he said something along the lines that Freedom just supplied one oversized PHE for all installations. Meanwhile, his subcontracted plumber was installing the PHE without contraflow, ie fluid in both circuits moved the same way. I haven't ever seen a bill of materials, and, as I said previously, the first time I came across the PHE was as it was installed. At the time, Freedom were very clear about the need for one. From the Freedom installer's manual:
Freedom appear to have stopped talking to end users, or at least me, again, they haven't replied to my last email, in which I asked about the remarkably steady primary flow rate, and why it isn't used to control output. I appreciate they are entitled to do this if they so wish, but as an interested end user I find it really is remarkably tedious and short-sighted.
Midea 14kW (for now...) ASHP heating both building and DHW
@cathoderay yes certainly the system overall isn't generating energy during the defrost, its spending it on the defrost actions, so its valid to treat the 1.8kwh as a negative value in the overall sum. My point is that this stage, spending ages on the maths of that isn't going to get you a warmer house or a more efficient system. There is also no point worrying about whether your HP can do 11kw, or 12kw, depending where on the spec sheet you are. As you can't even get close to that number.
you have a system that is constrained to about 8kw by the PHE, and until you do something about that, you're stuck.
My octopus signup link https://share.octopus.energy/ebony-deer-230
210m2 house, Samsung 16kw Gen6 ASHP Self installed: Single circulation loop , PWM modulating pump.
My public ASHP stats: https://heatpumpmonitor.org/system/view?id=45
11.9kWp of PV
41kWh of Battery storage (3x Powerwall 2)
2x BEVs
Posted by: @mike-hIan, would you be able to provide some photos and instructions on how to do something similar?
here's some photos.
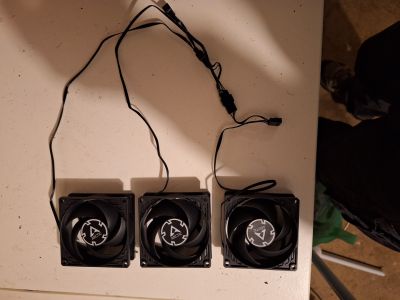
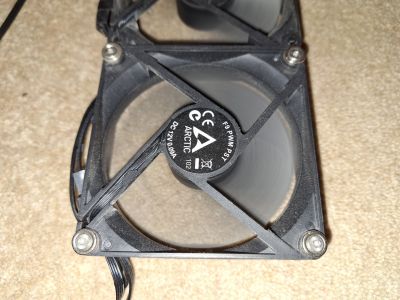
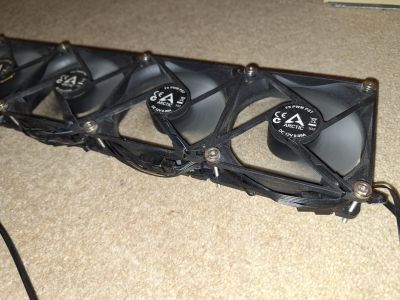
3x arctic PWM PST fans not built into array. showing the daisy chain of cabling - you only need to connect to one end. The array shown next picture is built with F9 PWM PST's, about £5 per fan when bought in bulk packs.
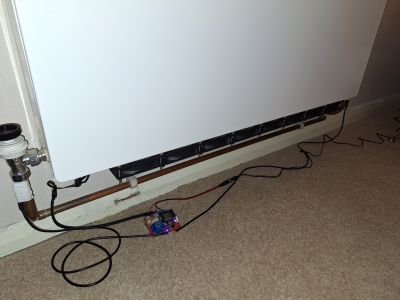
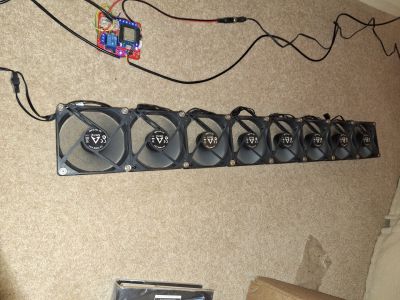
8 fan built unit installed under a K2 radiator. The magnets (shown later) hold it to the rails that run along the underside of the radiator. This is the bit that may vary with different radiators, you will just have to see what works to hold it on. It can't run the full length of the radiator as there are protrusions from the valves at each end. Controller sat on the floor (not pretty but it works). DS18B20 sensors taped to the pipes flow and return.
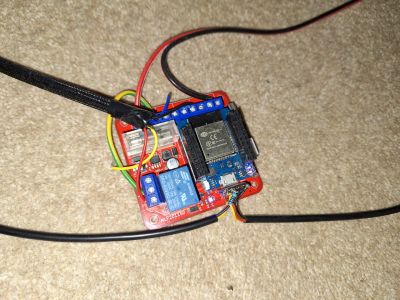
Controller zoom in. Its a mottram labs WS2811/WS2812 LED Driver board hosting an ESP32. This provides a relay (so I can switch the 12v line off completely) and a 5V PWM output . The ESP32 does 3.3V logic level PWM, wrong voltage to PWM a PC fan. Fan cable incoming top left. 12V power top right. Two DS18B20 sensors wired to an input at the bottom. The board is £15 (without ESP) but it did everything I needed in one neat unit. Logic its running is : OFF if temp less than 25, then ON with a ramp up of the PWM: 25% at 25-30C, 30% at 30-35C, 35% up to 40C. system never runs higher than 40C. these levels can be played with of course. For manually controlled system, standalone 12V PWM fan controllers are available, but in my case the ESP allows control from home assistant, and logging of the water temps and DT.
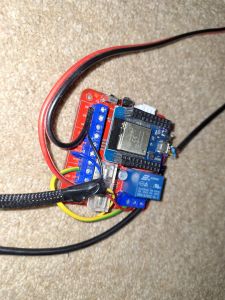
alternative angle. Thick Red+black from the top are DC in. Green/yellow is 12V dc to the relay, small red from the relay into the braided cable is switched 12V to the fans. Blue from the braided cable is PWM to the fans.
array of fans dismounted from radiator to show the complete unit build. Fans are blurred because its actually running.
zoom on a single fan in the array. Note magnets in each corner.
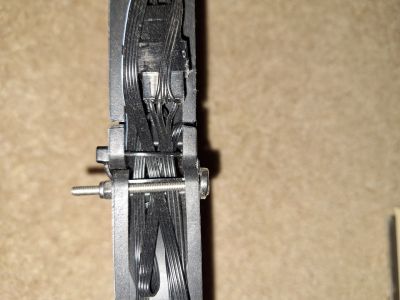
angled shot to show the daisy chained cabling tucked into the edge
and another edge on shot to show construction method. I used thin cable ties looped through the mounting holes, when pulled tight (with pliers) these are enough to hold the array rigid. magnet is bolted through the same mounting holes - needs to be a thin bolt to fit through same hole as cable tie. Don't overtighten the cable tie or the bolt as will crack the fan. broke a couple until I learned the right amount needed. ideally the bolt would be a few mm shorter, I could have sawn it but never bothered.
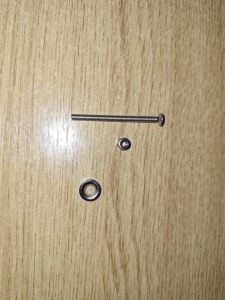
magnet kit: 3mm countersunk hole , 10mm diameter neodymium magnet + 3mm countersunk allen head bolt + nyloc nut.
cost : £40 fans, £20 controller board and esp, £2 DS18B20's, ~£10 magnets and bolts.
In this case its made about 1C of difference to the typical temperature of this room when running with the ASHP - moving it from 20C to 21C. That was worth doing as its our sitting room. Fitting a bigger rad would have been possible , but we replaced them with the more expensive flat fronted nicer looking ones only a couple of years before the ASHP fitting , as part of redecorating , so fitting the fan allowed me to not change the rads in this room when I fitted the ASHP.
My octopus signup link https://share.octopus.energy/ebony-deer-230
210m2 house, Samsung 16kw Gen6 ASHP Self installed: Single circulation loop , PWM modulating pump.
My public ASHP stats: https://heatpumpmonitor.org/system/view?id=45
11.9kWp of PV
41kWh of Battery storage (3x Powerwall 2)
2x BEVs
@iancalderbank Thanks so much for the detailed description and photos. That's amazing and it has given me the encouragement to have a go at something similar. Cheers, Mike
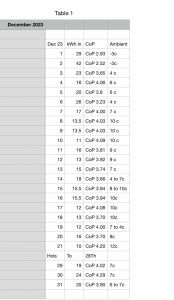
Our CoP took a bit of a caning this month so far. Just when we were trying to retrain Auto Adaptive to its new set of parameters. The attached chart shows CoP and KW consumption data for each day and the bar chart shows delivered heat. KW consumption is key when you operate a setback because continuous running generates a better CoP statistic but uses a significantly larger amount of energy. IE we are getting strong indications from an example in December 24 kWh consumed for a 24 hour period instead of 15 kWh for our 17.5 hour period for the same outside air temperature of 7degC. Having said that this needs further sample trials at continuous operation to substantiate. The last few days the outside temperatures have improved giving us a better CoP and kw consumption.
We live in an old timber framed farm workers cottage which has been extended and insulated although we have 2 draughty external doors which need attention.
Our Ecodan 8.5 at the moment operates on a 17.5 hours ‘on’ and 6.5 hrs ‘setback’ to 16 or 17c. We have finally got AA to behave by introducing 1.5 hour stepped temperature rises of 1 degC at a time which means AA only ‘sees’ the new temperature target when the room is almost already at the new target temperature. This appears to have stabilised with a slow ramp up to a 7am room temperature of 19.5c without overrunning as it used to. The day time temp is 20c and the evening temp is 21c from 5pm onwards until around 11pm although we switch to the setback at 9pm and the latent heat sticks around for 2 hours or so.
The December performance is in stark contrast to the colder weather of January with at least 10 days into a low CoP 4.
@iancalderbank - an update on the PHE inlet and outlet temps after setting the secondary pump to CC3. Took ten readings from each pipe then averaged the delta t values. Primary circuit delta t = 4, secondary circuit delta t = 6, maybe a bit better than it was before when the ratio was nearer 2.
I note you have come up against more Freedom LLH/buffer/PHE mayhem, this time on a Samsung unit. When end users are told they will void their warranty if they don't have one of these in place, end users understandably are likely to get nervous about removing them. Then throw in the various accounts of Freedom/GH saying they can be removed/aren't needed - and, well, you have to wonder, do these people know what they are talking about? Is the 'science' so primitive that it is still evolving, and changes in advice/requirements are to be expected? Or is it just yet another example of the heat pump industry suiting itself, without any regard for the end user?
Midea 14kW (for now...) ASHP heating both building and DHW
@iancalderbank and @cathoderay recognising that I may be over-simplifying- if the infrastructure (ie pipework and heat-emitters) cannot transmit the heat being supplied by the heat pump then surely this would be evident in a small delta-T between LWT and RWT. By contrast, if the heat-pump cannot supply enough heat to infra that is adequate then surely there will be a high delta. (In the first scenario, excess heat energy remains in the returning water and the opposite applies in the second where more is transferred to the house than the heat-pump can supply.)
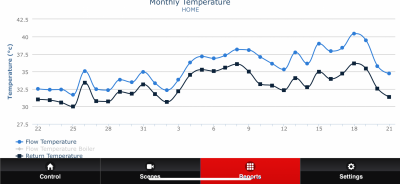
I guess that you may need to tinker with your pump speeds to determine what your situation is. (And I've just spent the last fortnight tuning my pump speeds to correct a persistent 2C delta-T and am waiting to see how things are in milder weather now I've got the delta between 4.5C and 5C- see photo.)
- 27 Forums
- 2,495 Topics
- 57.8 K Posts
- 383 Online
- 6,220 Members
Join Us!
Worth Watching
Latest Posts
-
RE: Solis inverters S6-EH1P: pros and cons and battery options
@batpred I reckon Andy might know a thing or 2 about...
By Bash , 3 minutes ago
-
RE: What determines the SOC of a battery?
@batpred Ironically you didn't have anything good to...
By Bash , 59 minutes ago
-
RE: Testing new controls/monitoring for Midea Clone ASHP
Here’s a current graph showing a bit more info. The set...
By benson , 1 hour ago
-
RE: Setback savings - fact or fiction?
True there is a variation but importantly it's understa...
By RobS , 1 hour ago
-

Below is a better quality image. Does that contain all ...
By trebor12345 , 2 hours ago
-
Sorry to bounce your thread. To put to bed some concern...
By L8Again , 2 hours ago
-

@painter26 — they (the analogue gauges) are subtly diff...
By cathodeRay , 2 hours ago
-

RE: Electricity price predictions
I am always impressed with how you keep abreast of so m...
By Batpred , 3 hours ago
-
RE: Humidity, or lack thereof... is my heat pump making rooms drier?
@majordennisbloodnok I’m glad I posted this. There see...
By AndrewJ , 3 hours ago
-
Our Experience installing a heat pump into a Grade 2 Listed stone house
First want to thank everybody who has contributed to th...
By Travellingwave , 6 hours ago
-
RE: Struggling to get CoP above 3 with 6 kw Ecodan ASHP
Welcome to the forums.I assume that you're getting the ...
By Sheriff Fatman , 9 hours ago
-
RE: Say hello and introduce yourself
@editor @kev1964-irl This discussion might be best had ...
By GC61 , 10 hours ago
-

RE: Oversized 10.5kW Grant Aerona Heat Pump on Microbore Pipes and Undersized Rads
@uknick TBH if I were taking the floor up ...
By JamesPa , 1 day ago
-

RE: Getting ready for export with a BESS
I would have not got it if it was that tight
By Batpred , 1 day ago
-
RE: Need help maximising COP of 3.5kW Valiant Aerotherm heat pump
@judith thanks Judith. Confirmation appreciated. The ...
By DavidB , 1 day ago
-

RE: Recommended home battery inverters + regulatory matters - help requested
That makes sense. I thought better to comment in this t...
By Batpred , 1 day ago
-
Bosch CS5800i 7kW replacing Greenstar Junior 28i
My heat pump journey began a couple of years ago when I...
By Slartibartfast , 1 day ago
-

RE: How to control DHW with Honeywell EvoHome on Trianco ActiveAir 5 kW ASHP
The last photo is defrost for sure (or cooling, but pre...
By JamesPa , 1 day ago
-

RE: Plug and play solar. Thoughts?
Essentially, this just needed legislation. In Germany t...
By Batpred , 1 day ago
-
RE: A Smarter Smart Controller from Homely?
@toodles Intentional opening of any warranty “can of wo...
By Papahuhu , 1 day ago
-
RE: Safety update; RCBOs supplying inverters or storage batteries
Thanks @transparent Thankyou for your advic...
By Bash , 1 day ago
-
RE: Air source heat pump roll call – what heat pump brand and model do you have?
Forum Handle: Odd_LionManufacturer: SamsungModel: Samsu...
By Odd_Lion , 1 day ago
-
RE: Configuring third party dongle for Ecodan local control
Well, it was mentioned before in the early pos...
By F1p , 2 days ago

