If you are going to keep records over a period of time, it may be useful to also note the weather conditions, to try to quantify the effects of solar gain and the other elemental changes that could affects the results.
@derek-m - good point, I will see if I can pull that out from the weather data as well. It may have cloud cover or hours of sunshine or something I can use as a proxy.
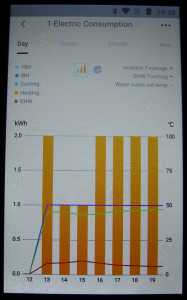
Here's a photo of the Midea app on my non-SIM mobile (easier to photo it than try and transfer a screen grab). The integer values are a bit suspicious, and I am not sure what happened to the DHW heating, which was definitely in use for about 20 mins between 1300 and 1400 and shows up as 2kWh on the History page, and it is a pity it records the Set LWT (which I presume is the weather comp set temp) rather than the actual LWT, and I am not sure how it knows the 1900 hour value at 1930 hours but at least I have something!
Midea 14kW (for now...) ASHP heating both building and DHW
The reading shown at 19:00 will be for the period from 18:00 to 19:00.
Because it is displaying energy consumption as integers, hourly calculations will not be very productive. At least it confirms that the weather compensation is working.
Posted by: @derek-mThe reading shown at 19:00 will be for the period from 18:00 to 19:00.
Because it is displaying energy consumption as integers, hourly calculations will not be very productive. At least it confirms that the weather compensation is working.
Hopefully the rounding errors will cancel out over time, so summed usage over a longer period will be more accurate, unless it always rounds up or down. This is typical black box stuff, no way of telling what is going on inside the black box. On the History page, it says it has produced 77kWh out for 23kWh in so far today (ie midnight to 0900), giving a nominal COP of 3.3 over a period when the ambient was around 4 degrees most of the time. If it carries on at the same rate, it will clock up around 60kWh used today, or 430kWh over the week. This is somewhat on the high side, around 11,162kWh over a six month heating season, or £3795 at today's current price cap of 0.34p per kWh plus of course standing charges as well as other non-heating use. That said, average temp over the whole heating season should be a bit higher than 4 degrees, so maybe the total will be a bit less. Time will tell.
Midea 14kW (for now...) ASHP heating both building and DHW
@cathoderay Honestly I think those 0.x numbers aren't really an issue. In the grand scheme when the heating really matters you are going to be using quite a lot of kW and the nominal difference a 0.x will make gets smaller and smaller. In the end the overall trend matters more than the figures. Increasing COP is the aim.
From my experience ambient SEEMS to be an average of the temperature over the whole day as I have never seen one below 3 degrees on my own system.
Also as a note the removal of the LLH seems to have made a big difference to my rads and ASHP settings. I've dropped the flow temps significantly for no downside (yet)
Posted by: @bataltoFrom my experience ambient SEEMS to be an average of the temperature over the whole day as I have never seen one below 3 degrees on my own system.
Sounds as though it may well be some sort of average. The ambients I will be using come from weather stations, I have one near enough to me to be good enough. The data are recorded every few minutes, I then average them over the hour to get hourly (average) temp. I think I may have posted this before, but this is the sort of chart I get, this one being April this year:
It's that cold snap at the beginning of the month and the ASHP in weather comp mode not coping that had me worried (and still does, as we haven't had sub zero temps yet this year). My kWh use went through the roof last April...
Midea 14kW (for now...) ASHP heating both building and DHW
@cathoderay heating will always be highest in the coldest weather. We had a few days last year of very high use. Below is the worst day when it averaged 3 degrees. I think we used well over 100kw total that day when you account for lights, oven etc - so at todays cap £34 a day...
Posted by: @bataltoI think we used well over 100kw total that day when you account for lights, oven etc - so at todays cap £34 a day...
Ouch.
I have currently got the hour by hour monitoring running, and will try to do some calculations tomorrow afternoon, once the 24 hour period has completed. This is just a test run, to see whether it works, ie the data is collectable and the analysis doable. It seems the local weather station doesn't record cloud cover or hours of sunshine, so that won't be in the analysis for now. Still no way of getting usable flow and LWT/RWT data, so unfortunately can't try the third method (Q=m×c×ΔT, energy = mass x specific heat capacity x temp difference method).
In another thread a while back @kev-m noted "I...have got weather comp working just about spot on with little intervention from the thermostats." It seems to me this is based on the premise that building heat loss equals ASHP heat input, and the weather comp curve adjusts the heat pump output to match the predicted building heat loss, and the end result is a steady state. It also suggests both curves are linear. If all this is the case, then it may not bo so crazy after all to work back from predicted heat loss to ASHP output, providing the building temp is in steady state.
Midea 14kW (for now...) ASHP heating both building and DHW
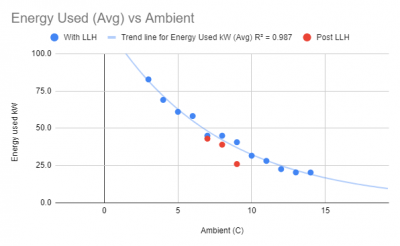
@cathoderay Its not quite linear from my own data collection - but pretty close. In essence what @kev-m noted is that you can adjust the weather compensation to get your steady state. You can do this by just cranking up your thermostat to always call for heat e.g. set it to 30, and control the actual temperature by adjusting your weather compensation. If its hotter than your desired temps, just lower it until you get to the right place. That's what I did previously. Set the controller to 22 and kept things at 21 through WC. Its not ideal, but its good enough.
@batalto - to my simple mind it should be linear, and I think I am right in saying the energy/flow/specific heat formula assumes it is but I can't argue with that trend line! Unless it is linear, and something is else affecting the readings at each end?
The Post LLH readings are interesting, in that they are all below the With LLH line, with possibly the difference more marked at higher ambients. With only three data points, its too early to say, but it will be interesting to see if that pattern remains over time. I think it might.
Midea 14kW (for now...) ASHP heating both building and DHW
@cathoderay in that graph the Y axis is power used. Below the line is better. Once I have more data I'll also plot a trend line
Posted by: @bataltoBelow the line is better.
I know! That's why I made the observation I did, and then said its early days ie only three data points.
As a matter of interest, what did you use to do the plot? It looks like the sort of thing that might have come from R, if so, I am impressed!
Midea 14kW (for now...) ASHP heating both building and DHW
- 27 Forums
- 2,495 Topics
- 57.8 K Posts
- 342 Online
- 6,220 Members
Join Us!
Worth Watching
Latest Posts
-
RE: What determines the SOC of a battery?
@batpred I didn't write the Seplos BMS software, I a...
By Bash , 11 minutes ago
-

RE: Electricity price predictions
Sorry to derail this thread ‘slightly?’ but back to the...
By Toodles , 20 minutes ago
-

RE: Humidity, or lack thereof... is my heat pump making rooms drier?
Without knowing it, @andrewj, you've laid down the gaun...
By Majordennisbloodnok , 39 minutes ago
-
RE: Testing new controls/monitoring for Midea Clone ASHP
@tasos and @cathoderay thanks. I have some history grap...
By benson , 43 minutes ago
-

I am having my existing heat pump changed to a Vaillant...
By trebor12345 , 1 hour ago
-
Our Experience installing a heat pump into a Grade 2 Listed stone house
First want to thank everybody who has contributed to th...
By Travellingwave , 2 hours ago
-
RE: Setback savings - fact or fiction?
@cathoderay The input power is largely determined by...
By RobS , 2 hours ago
-

RE: Solis inverters S6-EH1P: pros and cons and battery options
Just to wrap this up here for future readers: The S...
By Batpred , 4 hours ago
-
RE: Struggling to get CoP above 3 with 6 kw Ecodan ASHP
Welcome to the forums.I assume that you're getting the ...
By Sheriff Fatman , 4 hours ago
-
RE: Say hello and introduce yourself
@editor @kev1964-irl This discussion might be best had ...
By GC61 , 6 hours ago
-

@painter26 — as @jamespa says, it's for filling and re-...
By cathodeRay , 10 hours ago
-

RE: Oversized 10.5kW Grant Aerona Heat Pump on Microbore Pipes and Undersized Rads
@uknick TBH if I were taking the floor up ...
By JamesPa , 20 hours ago
-

RE: Getting ready for export with a BESS
I would have not got it if it was that tight
By Batpred , 22 hours ago
-
RE: Need help maximising COP of 3.5kW Valiant Aerotherm heat pump
@judith thanks Judith. Confirmation appreciated. The ...
By DavidB , 1 day ago
-

RE: Recommended home battery inverters + regulatory matters - help requested
That makes sense. I thought better to comment in this t...
By Batpred , 1 day ago
-
Bosch CS5800i 7kW replacing Greenstar Junior 28i
My heat pump journey began a couple of years ago when I...
By Slartibartfast , 1 day ago
-

RE: How to control DHW with Honeywell EvoHome on Trianco ActiveAir 5 kW ASHP
The last photo is defrost for sure (or cooling, but pre...
By JamesPa , 1 day ago
-

RE: Plug and play solar. Thoughts?
Essentially, this just needed legislation. In Germany t...
By Batpred , 1 day ago
-
RE: A Smarter Smart Controller from Homely?
@toodles Intentional opening of any warranty “can of wo...
By Papahuhu , 1 day ago
-
RE: Safety update; RCBOs supplying inverters or storage batteries
Thanks @transparent Thankyou for your advic...
By Bash , 1 day ago
-
RE: Air source heat pump roll call – what heat pump brand and model do you have?
Forum Handle: Odd_LionManufacturer: SamsungModel: Samsu...
By Odd_Lion , 1 day ago
-
RE: Configuring third party dongle for Ecodan local control
Well, it was mentioned before in the early pos...
By F1p , 2 days ago
-

RE: DIY solar upgrade - Considering adding more panels
I know this is a bit old, but it made me wonder what co...
By Batpred , 2 days ago


