We have had one radiator plumbed in an odd way in parallel to the heatsource, some 10 years ago. We had a "regular" boiler at the time, with a pump far away from the boiler. I queried it with the plumber years ago when he did it - he just said I didn't know what I was talking about, plumbed it how he liked, and I just left him to it - it seemed to work with the boiler - but who knew how well as nobody checked beyond everything "gets hot". Anyway, now we have a heatpump with a cop display - if I turn that radiator on then the COP plummets from 4 down to 3. It's because that radiator steals some of the flow from the heatpump, so the heatpump has a low flowrate and is forced to supply water inefficiently at a higher temperature (it is a simple heatpump).
In contrast all our other radiators are best left on full - the TRVs are removed from all downstairs radiators, leaving some adjustability in bedrooms.
@kev-m I can access the energy delivered and consumed but was hoping the MELcloud app would show me the COP like it does on your example. I don't have MMSP.
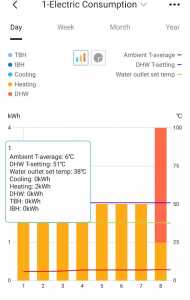
Interestingly my heating was turned off during the summer and the ASHP was only heating the DHW yet the MELcloud is still, as per my pic above, still shows energy being consumed for heating. What's that all about I wonder?
Retrofitted 11.2kw Mitsubishi Ecodan to new radiators commissioned November 2021.
14 x 500w Monocrystalline solar panels.
2 ESS Smile G3 10.1 batteries.
ESS Smile G3 5kw inverter.
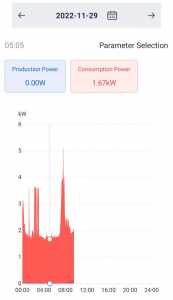
Here is a clear example for people on logging issues with apps. On the left you have the reported from my Midea app, 2kw per hour for the heat pump. On the right is the direct reading through my battery inverter, which tracks house load. Given my base load is around 400w the heat pump is drawing around 1.3/1.4kw - but reporting 2kw. Looks like Midea rounds up, so all my COP figures will actually be better than I calculated. I am going to ask Midea if they can update the app module to include decimal places.
Update from Midea
Q to Midea:
Thanks for your reply.
Please note that our technical team is already working on it, and we promise that it will be fixed as Soon as Possible.
Appreciate your patience.
Best regards,
Mark D
MSmartHome Support Team
Posted by: @morgan@kev-m I can access the energy delivered and consumed but was hoping the MELcloud app would show me the COP like it does on your example. I don't have MMSP.
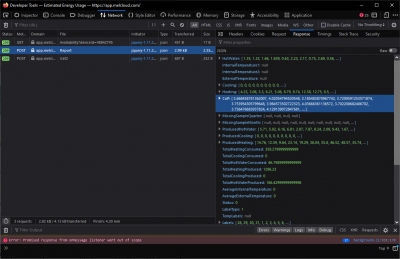
Like you, I don't have MMSP and I don't have a "CoP" line on my MELcloud. However, if you use the developer tools on your browser to see the raw JSON response of the report, it does actually contain that information, even though it doesn't show it on the graph.
This is what that looks like (in Firefox):
(hope that picture attaches properly)
I've made a script in R to download all the raw data returned in JSON format and plot it, but if you want to do that it's a bit technical. There's no easy way of doing it, and no public API, which is very frustrating...
Interestingly my heating was turned off during the summer and the ASHP was only heating the DHW yet the MELcloud is still, as per my pic above, still shows energy being consumed for heating. What's that all about I wonder?
My guess is that it's the "idle" power consumption that it attributes to heating (2-ish kWh per day, so 85-ish kW idle). I don't think any of it is measured particularly accurately without the MMSP stuff. Again, frustrating, not sure why that isn't just standard!
ASHP: Mitsubishi Ecodan 8.5kW
PV: 5.2kWp
Battery: 8.2kWh
Posted by: @scrchngwslHowever, if you use the developer tools on your browser to see the raw JSON response of the report, it does actually contain that information, even though it doesn't show it on the graph.
That is extremely interesting. I was hoping to do something similar with the Midea app, but Midea's app only runs on a smartphone in its own process, not through a browser with access to Developer tools. My intention was to be able to download the data so I can play with it and just as importantly keep historical records. I'm familiar with the basic process as a way of getting the data behind an onscreen chart. I've also dabbled in R (and usually end up tearing my hair out).
Has anyone found a way to access Midea data via a browser?
Midea 14kW (for now...) ASHP heating both building and DHW
Posted by: @bataltoPlease note that our technical team is already working on it, and we promise that it will be fixed as Soon as Possible.
AKA 'don't call us, we'll call you', 'the cheque's in the post' etc.
See also above posts on getting to Midea data via a browser - if we can do that, we will have a way of downloading data, instead of having to manually transcribe it. There may even be hidden gems that don't get plotted, as in the above example!
Midea 14kW (for now...) ASHP heating both building and DHW
Posted by: @scrchngwslPosted by: @morgan@kev-m I can access the energy delivered and consumed but was hoping the MELcloud app would show me the COP like it does on your example. I don't have MMSP.
Like you, I don't have MMSP and I don't have a "CoP" line on my MELcloud. However, if you use the developer tools on your browser to see the raw JSON response of the report, it does actually contain that information, even though it doesn't show it on the graph.
This is what that looks like (in Firefox):
-- Attachment is not available --
(hope that picture attaches properly)
I've made a script in R to download all the raw data returned in JSON format and plot it, but if you want to do that it's a bit technical. There's no easy way of doing it, and no public API, which is very frustrating...
Interestingly my heating was turned off during the summer and the ASHP was only heating the DHW yet the MELcloud is still, as per my pic above, still shows energy being consumed for heating. What's that all about I wonder?My guess is that it's the "idle" power consumption that it attributes to heating (2-ish kWh per day, so 85-ish kW idle). I don't think any of it is measured particularly accurately without the MMSP stuff. Again, frustrating, not sure why that isn't just standard!
What on earth are you talking about? Is this Greek? 😂
JSON, API, developer tools…………….. fair to say you lost me early on in your response 😂😂😂
Retrofitted 11.2kw Mitsubishi Ecodan to new radiators commissioned November 2021.
14 x 500w Monocrystalline solar panels.
2 ESS Smile G3 10.1 batteries.
ESS Smile G3 5kw inverter.
Posted by: @morganWhat on earth are you talking about? Is this Greek?
It might as well be Greek is you are not used to this stuff. JSON is just a way of storing data, a bit like a CSV file if you are familiar with them, but JSON is much more common on the web. API is Application Programming Interface, basically a gateway that allows others to query data from a server. In plain English, it is a web way of calling your bank and saying send me all transactions from the last month. Put these two (JSON and an available API) together and with the right code you can download data.
The problem is the API doesn't exist so we move on to method 2, basically looking behind the scenes to see what is being downloaded in the background. That's where browser Developer Tools come in, they allow us a way of seeing whats going on in the background. What @scrchngwsl's screen grab shows is a json response for various things eg Hot water, Heating and COP. Those strings of numbers are the individual data points. You can select them and then copy and paste them into a spreadsheet, and bingo, you have your own data.
Comment in passing: the COPs are to a vast number of decimal places. I suppose that is possible if they just do a division, but odd not to round them to say 2 decimal places.
Midea 14kW (for now...) ASHP heating both building and DHW
@cathoderay could you emulate an Android phone on the PC and capture the data coming in. Maybe via wireshark?
Posted by: @bataltocould you emulate an Android phone on the PC and capture the data coming in. Maybe via wireshark?
We talked about this a while back. Emulating android on a PC is a nightmare, and generally fails, mostly on connectivity eg Bluefang doesn't work, stuff in the emulator can't see stuff outside it, so can't set up the app. I had a look at wireshark, and it made my head hurt.
I'm wondering whether mi-cloud ( https://dashboard.mi-cloud.co.uk/login) is the way to go. As I said recently, it appears to have a consumer/home owner dashboard, but I only managed to get into an installer dashboard, and couldn't connect to anything. It's from our dear friends at Freedom, so I am not holding my breath.
Forecast for the next few days especially next weekend looks like it might get cold enough to test our systems a bit more thoroughly. A sort of mini beast from the east coming our way.
Midea 14kW (for now...) ASHP heating both building and DHW
Posted by: @cathoderayPosted by: @morganWhat on earth are you talking about? Is this Greek?
It might as well be Greek is you are not used to this stuff. JSON is just a way of storing data, a bit like a CSV file if you are familiar with them, but JSON is much more common on the web. API is Application Programming Interface, basically a gateway that allows others to query data from a server. In plain English, it is a web way of calling your bank and saying send me all transactions from the last month. Put these two (JSON and an available API) together and with the right code you can download data.
The problem is the API doesn't exist so we move on to method 2, basically looking behind the scenes to see what is being downloaded in the background. That's where browser Developer Tools come in, they allow us a way of seeing whats going on in the background. What @scrchngwsl's screen grab shows is a json response for various things eg Hot water, Heating and COP. Those strings of numbers are the individual data points. You can select them and then copy and paste them into a spreadsheet, and bingo, you have your own data.
Comment in passing: the COPs are to a vast number of decimal places. I suppose that is possible if they just do a division, but odd not to round them to say 2 decimal places.
Oh wow. Everything is now so much clearer.......................not 🤨 🤨 🤣
Probably best I give this topic a miss lol.
Retrofitted 11.2kw Mitsubishi Ecodan to new radiators commissioned November 2021.
14 x 500w Monocrystalline solar panels.
2 ESS Smile G3 10.1 batteries.
ESS Smile G3 5kw inverter.
-
Rate the quality of your heat pump design and installation
5 days ago
-
Vaillant Arotherm yeild and COP readings
1 year ago
-
What is the most important factor for you when choosing a heat pump brand?
2 years ago
-
Viessmann Vitocal 250-A in the UK
2 years ago
-
Slash Your Heat Pump Bills Overnight
2 years ago
- 27 Forums
- 2,495 Topics
- 57.8 K Posts
- 353 Online
- 6,220 Members
Join Us!
Worth Watching
Latest Posts
-

RE: Solis inverters S6-EH1P: pros and cons and battery options
@jancold I only discuss data.. Fogstar were not impress...
By Batpred , 12 minutes ago
-
RE: What determines the SOC of a battery?
@batpred Ironically you didn't have anything good to...
By Bash , 46 minutes ago
-
RE: Testing new controls/monitoring for Midea Clone ASHP
Here’s a current graph showing a bit more info. The set...
By benson , 60 minutes ago
-
RE: Setback savings - fact or fiction?
True there is a variation but importantly it's understa...
By RobS , 1 hour ago
-

Below is a better quality image. Does that contain all ...
By trebor12345 , 1 hour ago
-
Sorry to bounce your thread. To put to bed some concern...
By L8Again , 1 hour ago
-

@painter26 — they (the analogue gauges) are subtly diff...
By cathodeRay , 2 hours ago
-

RE: Electricity price predictions
I am always impressed with how you keep abreast of so m...
By Batpred , 3 hours ago
-
RE: Humidity, or lack thereof... is my heat pump making rooms drier?
@majordennisbloodnok I’m glad I posted this. There see...
By AndrewJ , 3 hours ago
-
Our Experience installing a heat pump into a Grade 2 Listed stone house
First want to thank everybody who has contributed to th...
By Travellingwave , 6 hours ago
-
RE: Struggling to get CoP above 3 with 6 kw Ecodan ASHP
Welcome to the forums.I assume that you're getting the ...
By Sheriff Fatman , 9 hours ago
-
RE: Say hello and introduce yourself
@editor @kev1964-irl This discussion might be best had ...
By GC61 , 10 hours ago
-

RE: Oversized 10.5kW Grant Aerona Heat Pump on Microbore Pipes and Undersized Rads
@uknick TBH if I were taking the floor up ...
By JamesPa , 1 day ago
-

RE: Getting ready for export with a BESS
I would have not got it if it was that tight
By Batpred , 1 day ago
-
RE: Need help maximising COP of 3.5kW Valiant Aerotherm heat pump
@judith thanks Judith. Confirmation appreciated. The ...
By DavidB , 1 day ago
-

RE: Recommended home battery inverters + regulatory matters - help requested
That makes sense. I thought better to comment in this t...
By Batpred , 1 day ago
-
Bosch CS5800i 7kW replacing Greenstar Junior 28i
My heat pump journey began a couple of years ago when I...
By Slartibartfast , 1 day ago
-

RE: How to control DHW with Honeywell EvoHome on Trianco ActiveAir 5 kW ASHP
The last photo is defrost for sure (or cooling, but pre...
By JamesPa , 1 day ago
-

RE: Plug and play solar. Thoughts?
Essentially, this just needed legislation. In Germany t...
By Batpred , 1 day ago
-
RE: A Smarter Smart Controller from Homely?
@toodles Intentional opening of any warranty “can of wo...
By Papahuhu , 1 day ago
-
RE: Safety update; RCBOs supplying inverters or storage batteries
Thanks @transparent Thankyou for your advic...
By Bash , 1 day ago
-
RE: Air source heat pump roll call – what heat pump brand and model do you have?
Forum Handle: Odd_LionManufacturer: SamsungModel: Samsu...
By Odd_Lion , 1 day ago
-
RE: Configuring third party dongle for Ecodan local control
Well, it was mentioned before in the early pos...
By F1p , 2 days ago


