A bit more analysis, but with the caveat that the data sets are small. I have however removed the double 1.18 correction factor, the data used in this post is to the best of my belief the correct data (E&OE).
In the previous analysis, I used all available data, on the simple assumption more is better, but there is a problem: the data covers a variety of conditions, and probably doesn't match any particular set of conditions at all well. It is just too heterogeneous. In particular, the long term average IAT (indoor air temperature) was not constant.
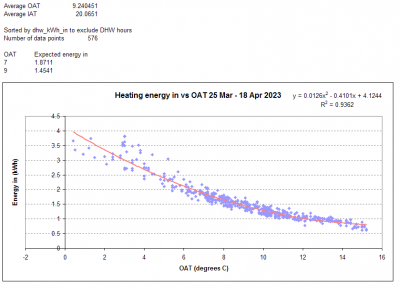
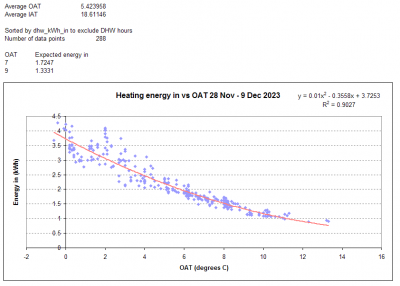
I have therefore selected two periods when the was some degree of stability, not a lot, just some, where there was also a reasonable spread of OAT (outside air temperature) values, and plotted hourly energy in against OAT for the periods. I also excluded hours when the DHW heating was on, as they typically have low heating energy in values, eg if the DHW is on for 40 mins and the heating will be on for 20 mins, and the hourly heating value will be around one third of what it would be for the full hour. I then added a trend line and equation for the trend line. The two periods are 25 March to 18 April 2023 and 28th November to 9th December 2023, with the start and set dates deliberately chosen to exclude visible aberrations, ie I only included periods of relative stability. Here are the plots, with some background numbers.
First period:
Second period:
The correlation is actually quite good, both visually and in the R squared values (both > 0.9), with no other adjustments, and - call me simple - the combination of the visual correlation, especially at OATs of 5 degrees and above, and the high R squared values, suggests, until proven otherwise, they are correlated, and the OAT can be used to predicted the energy in (used) for a given OAT. Both show, as expected, the energy in rises exponentially (though only slightly so) as the OAT falls (because of decreased efficiency). In both periods the spread increases notably at OATs of 5 degrees and below, which I strongly suspect is due to defrost cycles.
Comparing the two periods, the first spring period has a higher average IAT, 20.1 degrees, while the second more recent period has a lower average IAT of 18.6 degrees. The lower average OAT in the second period 5.4 vs 9.2 degrees in the first period doesn't in fact matter, because the OAT is the predictor variable, ie the equation takes it fully into account. However, the higher IAT does matter, it means, for a given OAT, I will use about 10% or thereabouts more energy to get the higher IAT. This is borne out in the data. In the first higher IAT period, the trend line equation predicts the hourly energy in will be 1.871 kWh at 7 degrees OAT, and in the second lower IAT period the trend line equation predicts 1.725 kWh at 7 degrees OAT. At 9 degrees OAT, the 1.454 and 1.333 kWh respectively. I point these numbers out because they are consistent with what we expect, and that, to me, suggests the equations do have some credibility, at least on this particular sanity check (for a given OAT, higher IAT = higher energy use).
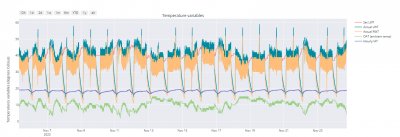
Returning to the setback period, I have taken the period 6th to 24 Nov 2023, which excludes the starting and ending aberrations, and covers a period of stable running which looks like this:
The average long term IAT stays constant at around 18.3 degrees, confirming there is no net energy gain or loss to the house during the period. There are, of course, diurnal variations, which is by design, a direct effect of the setbacks. There is perhaps some marginal comfort impairment, with slightly cooler early morning IATs at the settings I used (this being the first test of running setbacks, I was still very much learning), but they did not amount to anything of concern.
As the average IAT during the setback was only 0.3 degrees below the average IAT during the second non-setback period, I used the equation from that non-setback period to estimate for each hour in the setback period what the expected energy in would be for that hour at the given OAT for that hour. I then summed the total observed and expected energy in values for the entire period, and got the following results:
Observed total energy in with setback: 429 kWh
Expected total energy in without setback: 558 kWH
That suggests a saving over the total period of 129 kWh, equivalent on average to around 7 kWh per day, for a 6 hour 2100-0300 setback.
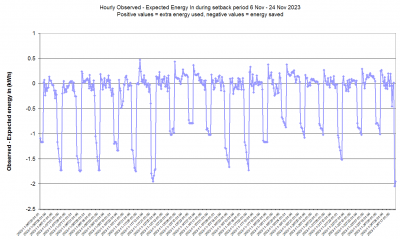
Doing hourly calculations means I can also plot the observed minus expected energy in for each hour. This is useful, because there are hour on hour variations that will be lost in summed 24 hour values. The plot looks like this:
This looks as expected. Most of the time (ie most of the day when setback is not in place), there is not that much difference between observed and expected. The setbacks are the large dips, but look at what happens immediately after each setback: the observed energy in almost invariably rises above the expected for an hour or more (most of the visible peaks occur at 0400, ie the hour after the setback), which is consistent with my auto-adapt script temporarily raising the WCC end points to provide a recovery boost, visible on the previous temperature variables chart. Then, as the actual IAT approaches the desired IAT, the auto-adapt script brings the WCC back to its normal standard position, and for most of the rest of the day the observed and expected energy values remain close. All this happens without the house experiencing a net heat loss or gain: over the longer term, the house stayed in energy balance.
Naturally there are wobbles and variations, this is real world data from a complex system, and on top of that, at the moment the data sets are not large. Nonetheless, there is just too much that does 'makes sense' in these observations and assessments for me readily to believe they are worthless. I also know that others running real all house air to water heating systems with and without setbacks have also come to much the same conclusions: by and large, setbacks do save energy, without materially compromising comfort. The likely exception is in OATs below five degrees, when defrosts kick in and cause mayhem. Contrary real world observations findings and conclusions, that setbacks don't save energy, or may even increase energy, have not been apparent, so far as I know.
The small size of the data sets does mean these findings are provisional, they are not the definitive answer. That will, I hope, become clearer, as more data comes in, albeit slowly, a day's data still takes a day to collect. But, at the very least, and until proven otherwise, they are suggestive.
Finally, all the other usual caveats (one atypical system, mad scientist cracks setback enigma, no laws of physics have been harmed in this study etc etc etc) all still apply.
Midea 14kW (for now...) ASHP heating both building and DHW
So, do you conclude that setbacks save energy without compromising comfort?
Retrofitted 11.2kw Mitsubishi Ecodan to new radiators commissioned November 2021.
14 x 500w Monocrystalline solar panels.
2 ESS Smile G3 10.1 batteries.
ESS Smile G3 5kw inverter.
Please correct me if I am wrong, but are there are now 3 versions of the y= formula. So which is correct?
I suppose the 'acid test' is does the system achieve the specified operating parameters suggested by James, and do the actual, and 'expected', Energy In values match just before the setback is initiated.
Posted by: @morganSo, do you conclude that setbacks save energy without compromising comfort?
Provisionally, yes. But I have to be cautious because the data sets are small, it's only one particular set up, etc etc. At this stage I think it is worth further exploration.
Midea 14kW (for now...) ASHP heating both building and DHW
Posted by: @derek-mPlease correct me if I am wrong, but are there are now 3 versions of the y= formula. So which is correct?
None of them. They are all provisional. In an ideal world, the latest one will be the best approximation.
Posted by: @derek-mI suppose the 'acid test' is does the system achieve the specified operating parameters suggested by James, and do the actual, and 'expected', Energy In values match just before the setback is initiated.
I am not sure Jame has suggested any 'specified operating parameters', and as you so kindly often remind us, we are all free to operate our systems at whatever parameters we choose to operate them at. There is however a very reasonable requirement specified by James for these sorts of assessments, that there should be no net gain or loss of heat to or from the building during the relevant period, basically the IAT must be at the same temperature at the end as at the beginning. This requirement is met.
Nor am I sure there is an acid test. That could only be done in tightly controlled laboratory conditions, which would - even if it could be done, which it can't - almost certainly mean the results would not apply to the messy real world. Sometimes, at the risk of repeating myself, you have to accept a good enough answer to the right question rather than an exact answer to the wrong question.
On the other hand, there is a partial answer to the alkali test: can the OAT be used to predict the energy in, and the answer to that is in the charts I posted earlier. Verbal answer: yes, fairly well at OATs 5 degrees and above, below five degrees it looks like defrost cycles confuse the picture, but even then, the prediction may be close to the average, and that may well be good enough - see my past comments on whether the energy in data for any given OAT is normally distributed.
Midea 14kW (for now...) ASHP heating both building and DHW
Posted by: @morganSo, do you conclude that setbacks save energy without compromising comfort?
The Laws of Physics would indicate that reducing the IAT by 1C should reduce electrical energy consumption by approximately 10%, so reducing IAT using a setback should indeed reduce electrical energy consumption.
The lower the IAT is allowed to fall, the more electrical energy that can potentially be saved.
I am a firm believer in encouraging anyone to try to save energy, but I am also concerned that this should not have a detrimental effect upon their lifestyle.
The problem is not whether setbacks should be used or not, but the variability of the UK weather, which could make the use of setbacks more problematic.
People have varying tolerance for changes in temperature, so for this reason I would neither encourage, or discourage, anyone from trying, or even using setbacks to reduce electrical energy consumption.
During moderate weather conditions I suspect that a reasonable setback would produce a reduction in electrical energy consumption, but my main concern would be when the weather turns cold, the IAT has fallen further than normal, and the heat pump is having to run flat out to raise the IAT or in a worse case, struggle to maintain the present lower IAT.
Unfortunately CathodeRay's data only shows averages, and does not show what happens at the extremes.
Don't let me deter you from trying to use setbacks, but I would just suggest that you do so with caution and keep an eye on the weather forecast.
I personally prefer the 'reverse setback' where the IAT is raised slightly during the warmer part of the day, and is then allowed to lower during the colder period, which means the heat pump would not be working as hard when it is least efficient, but the IAT is maintained at acceptable levels.
@cathoderay In spite of a great deal of ‘Hot Air’ (no disrespect intended!) circulated in this somewhat extended topic, I suspect that (to quote the one-time head of the London Planetarium) ‘Without coming to any firm conclusions’, we may all just carry on in blissful ignorance of whether we should employ setbacks and a possible saving or loss in energy used to heat our abodes or … whether we should just carry on as we are - in comfort and a set comfort level that we are happy with! Are we in the realms of ‘Known Unknowns’ and Unknown Knowns? Who knows? VBG!!! Regards, Toodles.
Toodles, heats his home with cold draughts and cooks food with magnets.
Posted by: @derek-mUnfortunately CathodeRay's data only shows averages, and does not show what happens at the extremes.
Not quite true, I chose the periods I did because they had some extremes, though not many, a reflection of the fact I have only been collecting data for a short time (about 13 weeks with the heating on). And while the hourly values are averages, the hourly interval is short enough to show some of the finer detail, indeed, that is the reason for using hourly rather than daily data in the latest analysis. That detail disappears in daily averages.
Midea 14kW (for now...) ASHP heating both building and DHW
Posted by: @cathoderayPosted by: @derek-mPlease correct me if I am wrong, but are there are now 3 versions of the y= formula. So which is correct?
None of them. They are all provisional. In an ideal world, the latest one will be the best approximation.
Posted by: @derek-mI suppose the 'acid test' is does the system achieve the specified operating parameters suggested by James, and do the actual, and 'expected', Energy In values match just before the setback is initiated.
I am not sure Jame has suggested any 'specified operating parameters', and as you so kindly often remind us, we are all free to operate our systems at whatever parameters we choose to operate them at. There is however a very reasonable requirement specified by James for these sorts of assessments, that there should be no net gain or loss of heat to or from the building during the relevant period, basically the IAT must be at the same temperature at the end as at the beginning. This requirement is met.
Nor am I sure there is an acid test. That could only be done in tightly controlled laboratory conditions, which would - even if it could be done, which it can't - almost certainly mean the results would not apply to the messy real world. Sometimes, at the risk of repeating myself, you have to accept a good enough answer to the right question rather than an exact answer to the wrong question.
On the other hand, there is a partial answer to the alkali test: can the OAT be used to predict the energy in, and the answer to that is in the charts I posted earlier. Verbal answer: yes, fairly well at OATs 5 degrees and above, below five degrees it looks like defrost cycles confuse the picture, but even then, the prediction may be close to the average, and that may well be good enough - see my past comments on whether the energy in data for any given OAT is normally distributed.
You obviously misunderstood my post. The 'specified operating parameters' that James was kind enough to suggest, were that the IAT should be within 0.5C of the desired value by breakfast time, and that it should be back at the desired level prior to the next setback commencing. As I believe you previously agreed, the actual Energy In and the 'expected' Energy In values, produced by the y= formula, should be the same at this point.
My concern is not that you appear to have a high tolerance to cold, but that not everyone shares this ability. You yourself had to stop using setbacks when the weather was cold, and your poorly performing heat pump could not meet the heating demand, so I would suggest a little caution in encouraging others to do the same.
If you would care to highlight the days that showed high and low extremes, I would be happy to run them through my spreadsheet, which not only takes account of variations in OAT, but also IAT, LWT, the calculated heat loss, the thermal heating capacity of the heat emitters, and the thermal mass of the building, whilst referencing the manufacturer's published data tables.
Posted by: @cathoderayPosted by: @derek-mUnfortunately CathodeRay's data only shows averages, and does not show what happens at the extremes.
Not quite true, I chose the periods I did because they had some extremes, though not many, a reflection of the fact I have only been collecting data for a short time (about 13 weeks with the heating on). And while the hourly values are averages, the hourly interval is short enough to show some of the finer detail, indeed, that is the reason for using hourly rather than daily data in the latest analysis. That detail disappears in daily averages.
It would appear that I am not making myself clear.
Could you please identify the day within your data when the OAT was at its lowest extreme and the day when it was at its highest extreme.
Unfortunately in the UK we do not get average daily weather, so if people are to use a setback regime, they need to know under what conditions it is likely to have a detrimental effect upon their comfort levels, and god forbid may actually be costing them more money.
Posted by: @toodles@cathoderay In spite of a great deal of ‘Hot Air’ (no disrespect intended!) circulated in this somewhat extended topic, I suspect that (to quote the one-time head of the London Planetarium) ‘Without coming to any firm conclusions’, we may all just carry on in blissful ignorance of whether we should employ setbacks and a possible saving or loss in energy used to heat our abodes or … whether we should just carry on as we are - in comfort and a set comfort level that we are happy with! Are we in the realms of ‘Known Unknowns’ and Unknown Knowns? Who knows? VBG!!! Regards, Toodles.
Hi Toodles.
As one of the forum moderators one of my duties is to try to ensure that any information provided is as accurate as possible, which is why I sometimes find it necessary to question some of the claims being made.
I would be very happy if forum members could make electrical energy reductions of 20% or more, but do not if they have to freeze to death in the process.
As no doubt many of the forum reader's will have become aware by now, home heating is quite a complex subject, which is not always open to simple interpretations. As an Engineer I deal in hard facts and the Laws of Physics and Thermodynamics, which are not easily 'bent' however much we would like to do so.
@cathoderay Prima facie this looks very interesting and a good fit once changes in the system are excluded, as you have done.
Can you tell us what the current confidence limits are on the constant in the fit (equation reproduced below). The final outcome will be very dependent on this, as its actually the dominant factor in the equation at the fairly mild temperatures during the setback period, when the energy in is 1.2-1.5kW vs a 'constant' of 3.7.
4kW peak of solar PV since 2011; EV and a 1930s house which has been partially renovated to improve its efficiency. 7kW Vaillant heat pump.
- 27 Forums
- 2,495 Topics
- 57.8 K Posts
- 541 Online
- 6,220 Members
Join Us!
Worth Watching
Latest Posts
-

RE: Humidity, or lack thereof... is my heat pump making rooms drier?
That’s my pleasure, @andrewj. The only challenge now is...
By Majordennisbloodnok , 8 minutes ago
-
RE: Electricity price predictions
@toodles @skd Then there is not going to be much from t...
By ChandyKris , 53 minutes ago
-
RE: Solis inverters S6-EH1P: pros and cons and battery options
@batpred I reckon Andy might know a thing or 2 about...
By Bash , 1 hour ago
-
RE: What determines the SOC of a battery?
@batpred Ironically you didn't have anything good to...
By Bash , 2 hours ago
-
RE: Testing new controls/monitoring for Midea Clone ASHP
Here’s a current graph showing a bit more info. The set...
By benson , 3 hours ago
-
RE: Setback savings - fact or fiction?
True there is a variation but importantly it's understa...
By RobS , 3 hours ago
-

Below is a better quality image. Does that contain all ...
By trebor12345 , 3 hours ago
-
Sorry to bounce your thread. To put to bed some concern...
By L8Again , 3 hours ago
-

@painter26 — they (the analogue gauges) are subtly diff...
By cathodeRay , 4 hours ago
-
Our Experience installing a heat pump into a Grade 2 Listed stone house
First want to thank everybody who has contributed to th...
By Travellingwave , 7 hours ago
-
RE: Struggling to get CoP above 3 with 6 kw Ecodan ASHP
Welcome to the forums.I assume that you're getting the ...
By Sheriff Fatman , 10 hours ago
-
RE: Say hello and introduce yourself
@editor @kev1964-irl This discussion might be best had ...
By GC61 , 12 hours ago
-

RE: Oversized 10.5kW Grant Aerona Heat Pump on Microbore Pipes and Undersized Rads
@uknick TBH if I were taking the floor up ...
By JamesPa , 1 day ago
-

RE: Getting ready for export with a BESS
I would have not got it if it was that tight
By Batpred , 1 day ago
-
RE: Need help maximising COP of 3.5kW Valiant Aerotherm heat pump
@judith thanks Judith. Confirmation appreciated. The ...
By DavidB , 1 day ago
-

RE: Recommended home battery inverters + regulatory matters - help requested
That makes sense. I thought better to comment in this t...
By Batpred , 1 day ago
-
Bosch CS5800i 7kW replacing Greenstar Junior 28i
My heat pump journey began a couple of years ago when I...
By Slartibartfast , 1 day ago
-

RE: How to control DHW with Honeywell EvoHome on Trianco ActiveAir 5 kW ASHP
The last photo is defrost for sure (or cooling, but pre...
By JamesPa , 1 day ago
-

RE: Plug and play solar. Thoughts?
Essentially, this just needed legislation. In Germany t...
By Batpred , 1 day ago
-
RE: A Smarter Smart Controller from Homely?
@toodles Intentional opening of any warranty “can of wo...
By Papahuhu , 1 day ago
-
RE: Safety update; RCBOs supplying inverters or storage batteries
Thanks @transparent Thankyou for your advic...
By Bash , 2 days ago
-
RE: Air source heat pump roll call – what heat pump brand and model do you have?
Forum Handle: Odd_LionManufacturer: SamsungModel: Samsu...
By Odd_Lion , 2 days ago
-
RE: Configuring third party dongle for Ecodan local control
Well, it was mentioned before in the early pos...
By F1p , 2 days ago


