Creative trials on Night-time Setbacks to @ faster recovery, improved comfort and even greater energy reductions.
@morgan yes, I don’t know why it reads hourly temperature when it should read “temperature history”. I hope you are now seeing the correct graph lines. I guess it may say hourly temperature because it is divided in to 24 hourly divisions.
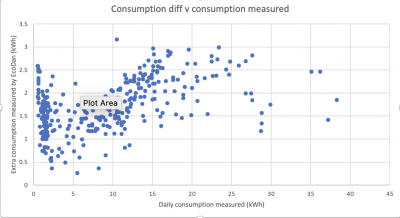
The Ecodans just do not have a meter-grade electricity monitoring capacity. There is an over-estimation of the daily consumption that is not consistent, so not easily accountable for. I have a record of accurately measured values of the consumption of my Ecodan, a meter on the supply to the outdoor unit which also then feeds through to the packaged cylinder. If I take the daily measured values and chart them against a calculated value for the difference to the reported consumption figures from MelCloud it produces the following:
Although there is a broad trend for the overestimation to increase as the consumption increases, the linear cluster on the left shows there is a similar range of overestimation even when the actual consumption is only the 600Wh or so that the FTC itself is using when no heat is being generated. Overall for 2023 the difference between measured and estimated consumption is 664 kWh - or 17% of my total energy usage.
My example might be usefully typical, or it might not; I have read others' estimations which are different. So although there is an option in the settings to increase or decrease the value recorded for the energy input in percentage terms, without a benchmark measurement to derive that difference it would just be guesswork. And there would still be a varying amount of inaccuracy day to day.
I don't think there is a simple setting adjustment or mis-programming where controller is applying a spurious correction factor for pumps that may not exist, there are plenty of adjustments that can be made in the settings to account for what hardware is attached to the unit. But Mitsubishi themselves state if you want accurate energy measurements you have to add an external meter - they have not added the electronics to do it within the unit.
Mitsubishi EcoDan 8.5 kW ASHP - radiators on a single loop
210l Mitsubishi solar tank
Solar thermal
3.94kW of PV
@harriup thanks for your post it’s good to get a different perspective on this consumption challenge. You have done a lot of work in gathering MELCloud vs actual data it’s very relevant to my question. Thanks for the post.
you are right I was hoping for a magic variable and in many ways that’s what you’ve posed in your graph. But as you suggest in your post this may or may not be comparable with other ecodan setups.
My motive for this line of thought is that there are many people who come to this website and who don’t have any metered data and are only looking at Ecodan estimates. Very often puzzled and a little panicked by the perception of unreliable information.
With practise and experience I am happy that you can interpret efficient operation from problematic signs just from the raw MELCloud data but I think this is a big ask to a new owner to do the same when there are signs of inconsistent data.
I apologise for the late reply but have been away for a few days.
thanks again for your post.
@sunandair Hi there, really interesting experiment! So if I understand correctly, your conclusion is that nightly setbacks actually save energy (and therefore money assuming fixed tariffs) for your specific property? And on some days quite a bit actually! All these experiments were run in in Auto Adaptive mode?
Have you ever tried to write some code to automate the optimisation?
CEO and co-founder at HavenWise
Posted by: @hcas@sunandair Hi there, really interesting experiment! So if I understand correctly, your conclusion is that nightly setbacks actually save energy (and therefore money assuming fixed tariffs) for your specific property? And on some days quite a bit actually! All these experiments were run in in Auto Adaptive mode?
Have you ever tried to write some code to automate the optimisation?
Hi HCas
yes, I’m glad you’ve found it interesting. There appears to be a roughly 3 kw saving per night on a 10kwh day and a similar saving on a 15 KWh day but when the auto defrost is operational and freeze stat function is active the savings become quite large. This I believe, is because the set back period overnight doesn’t have any, or so many, defrost cycles. Even when the auto reheat kicks in the freeze stat function is a gentler output so often doesn’t evoke a frosting up of the fins and usually finishes before a full defrost is begun.
The earlier tests up to 14th January were mostly weather compensation mode Andy after 14th January we switched the trial so over to Auto Adaptive mode.
I haven’t looked at coding anything since the reason for these trials was to help people with minimal knowhow and basic factory fitted technology. This imo should be everyday products for everybody’s access. But you’re probably right there needs to be improvements in what’s delivered.
Thanks SUNandAIR!
3 kWh on 10 or 15 kWh is substantial, and more than I expected to be honest. So I guess for you the setbacks are now the default?
Is your Ecodan wifi enabled?
CEO and co-founder at HavenWise
@hcas yes we are pretty much settled with a 3 C setback each night now. There could be several reasons for saving energy on a night time set back; not least because night times generally are colder, especially on clear sky nights, so operating a heat pump at night is the most costly time to operate a heat pump. Regarding the Ecodan connectivity, it does have wireless connections and the MELCloud app is part of the Ecodan connectivity. But I also think Mitsubishi somehow control what third party devices can access the op system and appear a little guarded in what parts are accessible.... I think so anyway? There appears to be a bit of technological rivalry between manufacturers which may spill over into limited integration of new devices.
You may have heard of the Homely system? It is interesting that it isn’t accessible with Mitsubishi and their Ecodan HeatPumps as yet. But I’m not sure if that is Homely being selective or if it is Mitsubishi trying to monopolise how their systems are controlled.
It would be good to know how open and progressive these heat pump manufacturers really are.
@sunandair Yes good point on the temperature during the night and impact on the heat pump efficiency! I've seen similar effects in some simulations I've done. In some instances for instance, if temperature is expected to drop, sometimes it's better to pre-heat a little bit when temperature is still high.
Yes I've come across Homely. Not sure why they are not compatible with Ecodan. Could be a lot of different reasons... Not the least because they need hardware and a bunch of installer resources so installers can actually install them. I'm checking if there is a way around that actually. I sent you a DM as well on this.
On openness, I've spoken to a company which entire business is integrations with all kinds of manufacturers (batteries, EV chargers, and heat pump manufacturers). They are saying manufacturers are increasingly open, also in part because they are forced by EU regulation.
CEO and co-founder at HavenWise
Posted by: @harriupAlthough there is a broad trend for the overestimation to increase as the consumption increases, the linear cluster on the left shows there is a similar range of overestimation even when the actual consumption is only the 600Wh or so that the FTC itself is using when no heat is being generated. Overall for 2023 the difference between measured and estimated consumption is 664 kWh - or 17% of my total energy usage.
Your graph shows some interesting correlations. Simple question- Can you confirm if the 17% difference in estimated consumption is of your total HP measured or total household. (I’m presuming it’s HP)
While your graph shows the Ecodan estimations are quite variable and may well not show any proportional way it has been calculated it does at least show you’re measured consumption over a large number of days use. If I’m reading your comments correctly you’re findings does, at least, give you an average over estimation from the Ecodan system.
Do you think that from this information you would be able to correct your cop figures in a viable way? To the point where you could simply remove a percentage from your daily or monthly stats to correct your CoP stats?
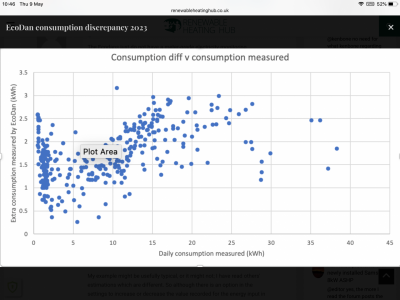
I’ve put a copy of your graph here.
I have a meter on the dedicated HP circuit, so I know exactly what the HP is consuming. It is that that enables me to make the comparison with values provided by the EcoDan itself.
I keep a spreadsheet of daily data values for the HP and PV - a bit tedious to update every now and again, perhaps one day I'll find out if it is possible to automate in some way. But obviously I use the metered data as I have it along with the EcoDan's generated energy data to calculate COP values.
If that meter was to fail I could fudge a COP based on the EcoDan's own usage figures – but I would use a deduction of 1.8kWh each day to modify them. There would be a margin of error of about 1.2kWh either way given the spread of the variation I have recorded on my system.
Using a percentage change would over-reduce the winter figures giving me a much better COP but leave the summer figures not changed enough, in fact it would probably double the value of the summer consumption and halve the resulting COP.
Mitsubishi EcoDan 8.5 kW ASHP - radiators on a single loop
210l Mitsubishi solar tank
Solar thermal
3.94kW of PV
Posted by: @harriupperhaps one day I'll find out if it is possible to automate in some way
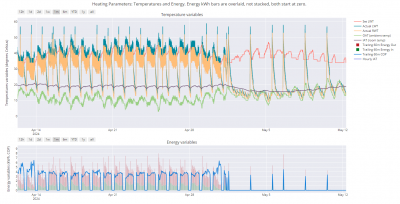
It is certainly possible, using a modbus connection. If your dedicated HP circuit meter has modbus (or you get one that does have a connection, if your current one does not), then it is a simple two wire connection to something that can collect modbus data eg a mini PC running a python script (or possibly Home Assistant, though I don't know the details, others do). Likewise, if your ASHP has modbus, or can be made to have modbus, you can also collect data from it. See my Real world connection to a heat pump over modbus thread for some details (still not complete, but enough to get you started). Here's my data for the last month (interval can be changed at will), readings taken every minute, all done automatically, just needs double click from me on a desktop icon to get the data displayed like this:
Midea 14kW (for now...) ASHP heating both building and DHW
Picking up this thread from last year
Following discussion on what is missing in the controls of heat pumps I've done a trial on a different kind of setback for overnight operation which might be more efficient than simply dropping the target room temperature.
On the Ecodan controls the only way to operate a scheduled setback is to program a temperature drop on the set temperature control. On the current system there is no way, in weather compensation of making a setback FLOW TEMPERATURE.
Im suggesting that there is already a theoretical advantage of making a setback using flow temperature drop of say 5c and based on the widely quoted benefit of a 3% energy saving for every 1c reduction in flow temperature. This would mean a potential 15% saving on just a room temperature setback of say 2c.
But there would appear to be a second big saving which only revealed itself during the test responses from the heat pump.
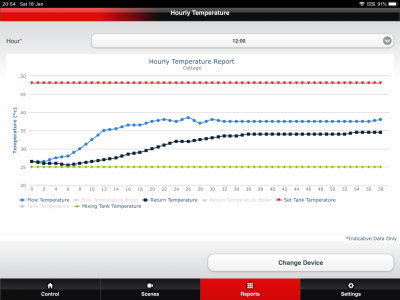
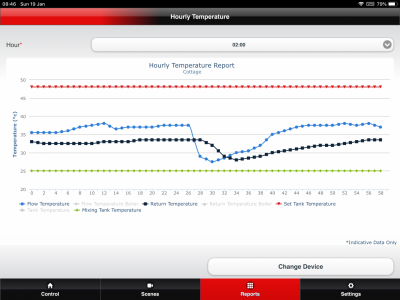
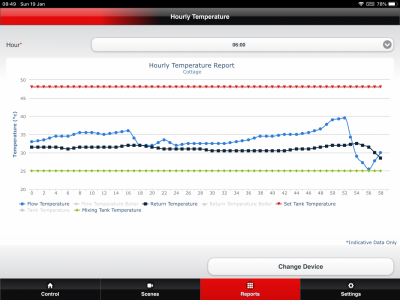
The first thing to notice in the reheat graph is the large ramp up when the room stat setback temperature is reached. This is because the HP is following the NORMAL WEATHER COMPENSATION CURVE. However this is night time. Do we need a heavy duty ramp up?
Another costly activity of the heat pump is the defrost cycle which only takes about 5 minutes to complete but induces another ramp up and the return flow temperature takes around 25 minutes to reach its pre-defrost temperature.
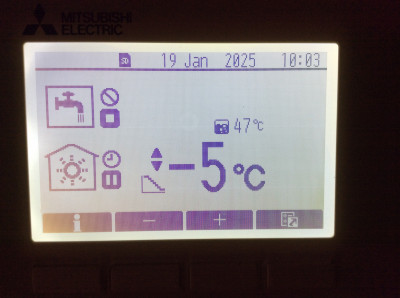
The Ecodan controller has an on screen flow temp adjustment option. This simply adjusts the weather compensation curve flow temperature up or down. So we have induced a low reaction setback by manually adjusting downwards the flow temperature to -5c.
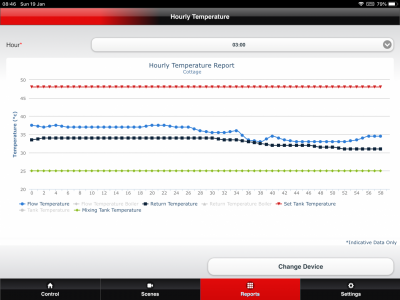
The resulting lower flow resulted in a gentler start during the overnight setback. It was lowered in 2 stages from 40c down to 38c and then finally to 35c flow temp. The first graph shows the step change at 3.35am.
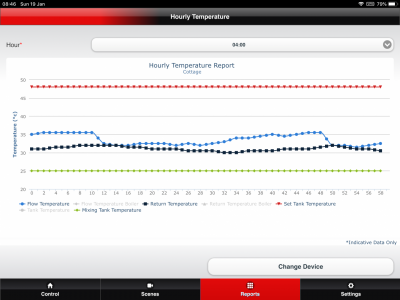
The last graph shows the flow temperature returned to the normal WC Curve setting. You might notice it goes straight into defrost mode when the flow temp is raised back to normal.
Here is the hidden result...
the outside ambient temperature was 2c so we were operating with hourly defrosts.
However, by reducing the Flow Temperature the system appeared to operate below the rapid output which induces the defrost cycle.
This low flow temp adjustment of 5c off the WC Curve appears to have saved 8 defrosts. In addition to have reduced the consumption by as much as 10 to 15%.
If only this WC Curve setback was available as a scheduled setting as a night time setback.
(resultant temp drop at 6am showed a room temp of 18.5c. This raised to 20c during normal operation by 9am)
- 27 Forums
- 2,495 Topics
- 57.8 K Posts
- 400 Online
- 6,220 Members
Join Us!
Worth Watching
Latest Posts
-

RE: Humidity, or lack thereof... is my heat pump making rooms drier?
Without knowing it, @andrewj, you've laid down the gaun...
By Majordennisbloodnok , 10 minutes ago
-
RE: Testing new controls/monitoring for Midea Clone ASHP
@tasos and @cathoderay thanks. I have some history grap...
By benson , 14 minutes ago
-

I am having my existing heat pump changed to a Vaillant...
By trebor12345 , 47 minutes ago
-
Our Experience installing a heat pump into a Grade 2 Listed stone house
First want to thank everybody who has contributed to th...
By Travellingwave , 1 hour ago
-
RE: Setback savings - fact or fiction?
@cathoderay The input power is largely determined by...
By RobS , 2 hours ago
-

RE: Electricity price predictions
@transparent Im impressed by all your work on this. ...
By JamesPa , 3 hours ago
-

RE: Solis inverters S6-EH1P: pros and cons and battery options
Just to wrap this up here for future readers: The S...
By Batpred , 4 hours ago
-
RE: Struggling to get CoP above 3 with 6 kw Ecodan ASHP
Welcome to the forums.I assume that you're getting the ...
By Sheriff Fatman , 4 hours ago
-

RE: What determines the SOC of a battery?
I agree. Fogstar confirmed that the Seplos BMS does ...
By Batpred , 4 hours ago
-
RE: Say hello and introduce yourself
@editor @kev1964-irl This discussion might be best had ...
By GC61 , 6 hours ago
-

@painter26 — as @jamespa says, it's for filling and re-...
By cathodeRay , 9 hours ago
-

RE: Oversized 10.5kW Grant Aerona Heat Pump on Microbore Pipes and Undersized Rads
@uknick TBH if I were taking the floor up ...
By JamesPa , 20 hours ago
-

RE: Getting ready for export with a BESS
I would have not got it if it was that tight
By Batpred , 22 hours ago
-
RE: Need help maximising COP of 3.5kW Valiant Aerotherm heat pump
@judith thanks Judith. Confirmation appreciated. The ...
By DavidB , 1 day ago
-

RE: Recommended home battery inverters + regulatory matters - help requested
That makes sense. I thought better to comment in this t...
By Batpred , 1 day ago
-
Bosch CS5800i 7kW replacing Greenstar Junior 28i
My heat pump journey began a couple of years ago when I...
By Slartibartfast , 1 day ago
-

RE: How to control DHW with Honeywell EvoHome on Trianco ActiveAir 5 kW ASHP
The last photo is defrost for sure (or cooling, but pre...
By JamesPa , 1 day ago
-

RE: Plug and play solar. Thoughts?
Essentially, this just needed legislation. In Germany t...
By Batpred , 1 day ago
-
RE: A Smarter Smart Controller from Homely?
@toodles Intentional opening of any warranty “can of wo...
By Papahuhu , 1 day ago
-
RE: Safety update; RCBOs supplying inverters or storage batteries
Thanks @transparent Thankyou for your advic...
By Bash , 1 day ago
-
RE: Air source heat pump roll call – what heat pump brand and model do you have?
Forum Handle: Odd_LionManufacturer: SamsungModel: Samsu...
By Odd_Lion , 1 day ago
-
RE: Configuring third party dongle for Ecodan local control
Well, it was mentioned before in the early pos...
By F1p , 2 days ago
-

RE: DIY solar upgrade - Considering adding more panels
I know this is a bit old, but it made me wonder what co...
By Batpred , 2 days ago

