Creative trials on Night-time Setbacks to @ faster recovery, improved comfort and even greater energy reductions.
This thread is initially intended to share trials I have done on creative variations of what is loosely known as a night time setback. The findings so far have compared operation in Auto Adaptive mode and separately in Weather Compensation mode.
Posts will be added shortly.
Posted by: @sunandairThis thread is initially intended to share trials I have done on creative variations of what is loosely known as a night time setback. The findings so far have compared operation in Auto Adaptive mode and separately in Weather Compensation mode.
Posts will be added shortly.
Thank you for joining in, the more data the better.
@derek-m you’re welcome...
This thread will take a different stance from your data driven modelling in Cathoderay’s thread since it’s obviously difficult to be creative, policing and absolute at the same time.
I hope you enjoy it 👍
Over 50 trials of setbacks vs continuous operation.
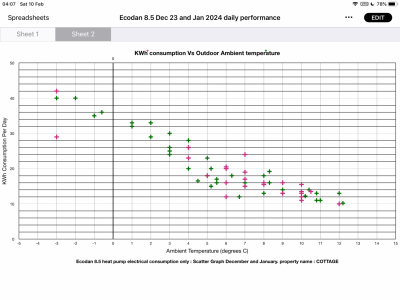
Here is a scatter graph of this winter operation of our Ecodan 8.5 to date. The setup is a Ratiators only installation consisting of 16 radiators, 180sqMtres four bedroom house. Old timber framed farm workers cottage with internal cellotex insulation and 300mm loft rock wool. The internal wall insulation makes the property a fairly low mass interior environment. The chart compares energy consumed in a 24 hour period vs the Outside Air Temperature. (KWh vs OAT degC)
To attempt to give consistent comparison to the results we have targeted identical periods of setback and a constant 21c room temperature within the period 8am - 10.30pm. However perhaps the most difficult challenge has been to accurately interpolate the often variable Outside Air Temperature. carefully monitored Outside Air Temperature and adjusted to a mean when required.
We have only trialed 4 continuous 24 hour operations of the heat pump in an attempt to establish how much energy might be saved. However none of the 24 hour continuous operation trials are in the colder ambients below 3degC.
As a challenge: can anybody identify the 4 continuous heat pump operation trials?
(So as a clue, none of the continuous 24 hour operation trials took place when the outside ambient temperature was below 3C.)
The pink crosses are January days and the green crosses are January and February days.
Data is from Mitsubishi MELCloud 24 hour energy report and FTC main controller daily energy report.
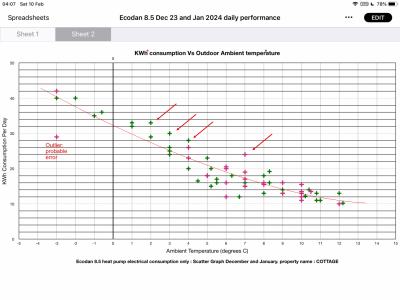
@sunandair - interesting. I have added an eyeballed trend line, ignoring the outlier, and the general shape of the curve is very similar to the curves I get. Your spread about the mean for a given OAT is greater however:
Dealing with the OAT is problematic, 24 hour period may have a nearly steady OAT, another considerable variation, yet the both have the same mean, despite being different from a heating requirement perspective. I did vaguely look at using 'degree hours' (analogous to degree days) but it quickly gets complicated.
Arrows point to my guesses for the continuous running days!
Midea 14kW (for now...) ASHP heating both building and DHW
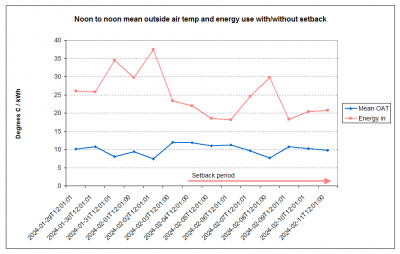
I've been running with 6 hour overnight setbacks for the last week. Here is the last two weeks noon to noon mean OAT and energy use, left hand side no setback, right hand side with setback:
Mean OAT's haven't varied that much (but noting what I said in my last post, I checked the diurnal variation and it too has been pretty steady). It does seem on like for like mean OAT periods, the total energy use is less on setback days. Comfort has been fine. Usual caveats apply.
Midea 14kW (for now...) ASHP heating both building and DHW
Posted by: @heacolHow is your system controlled?
Continuous running: weather compensation (room stat at 26 ie 'always on'); setbacks timed by turning the room stat down to 12 degrees between 2100 and 0300, meaning in effect always off during the setback. I am using the room stat timer not for room temps, but as an on/off timer.
I also have - and this is the important bit I think - a basic DIY auto-adaption function which is a short python script that checks the actual indoor air temp against the desired (not set, that changes) indoor air temp of 19 degrees every hour and then adjusts the ends of the weather curve accordingly up to a max of 3 degrees either way, eg if actual is one degree below desired, then weather curve LWT end points go up one degree etc etc. This seems to work quite well, there is usually a visible recovery boost for an hour or so after the setback in the hourly energy use data. The script uses wired modbus for the connection.
Midea 14kW (for now...) ASHP heating both building and DHW
@cathoderay Thanks for your observations. I need to correct a chart comment I made on my last post. The pink coloured crosses are December data not January. That means the green crosses are January and February data...
I was thinking our consumption clusters were getting closer in energy consumption now that we have got it operating in Auto Adaptive room temp mode. Also our trend line might be very horizontal at the warmer end because our weather compensation curve becomes horizontal with a setting of 32c flow temp at 9c and onwards Ambient.
Thanks also for your post on your own 24 hour operation there’s been quit a few days around the 10c temperature this year....
Regarding your guesses on the 24 hour operation you’ve managed to locate one of them. Well done.....
Posted by: @cathoderayI've been running with 6 hour overnight setbacks for the last week. Here is the last two weeks noon to noon mean OAT and energy use, left hand side no setback, right hand side with setback:
-- Attachment is not available --
Mean OAT's haven't varied that much (but noting what I said in my last post, I checked the diurnal variation and it too has been pretty steady). It does seem on like for like mean OAT periods, the total energy use is less on setback days. Comfort has been fine. Usual caveats apply.
Hi Ray
Looking at your chart you seem to have a stark increase in energy use for only a small drop in outside ambient. IE dropping from 10c to 8c approx you appear to have an increase in energy consumption of about 10 kWh or more. But it’s interesting (and hopeful) to see elevated consumption for the 24 hours continuous usage.
A note on my mean Ambient temperature adjustment.
inevitably from everyones findings, it is obvious that a drop in Ambient Temperatures has a massive increase in the Heat Pump’s energy consumption which seems disproportionate to the scale of the drop. Therefore I have modified my mean temperature selection on all variable temperatures in the outside.
1. I select 1third of the temperature variation rather than 50:50 middle mean temperature. In other words if there is a 6c variation in a day I select a +2c from the lower temperature rather than the mid way point of 3c. This is still not very refined but it irons out some of the inaccuracies of the high consumption differential which would otherwise create an inaccurately higher outside ambient temperature for the day’s energy consumption.
2. I also only look at temp variation during the heating-on period and not the full 24 hour period - so I ignore temperature fluctuation during the set back period. While 24 hour operation takes account of the full 24 hour period of outside temperatures during HP operation.
i hope this makes sense and I haven’t broken any golden rule of data gathering 😱
Posted by: @derek-mAre the OAT values from the heat pump sensor?
Yes, as has been all my OAT data to date, meaning charts are comparable, as in showing the same data from the same sensor.
I do now have an outdoor modbus temperature sensor, but I am still working on where to put it such that it is outside but not in direct sunlight, and the wiring can be got to it relatively painlessly, and without leaving connections exposed to the elements. The sensor does have 1m of cable attached to it, but I don't want it to be the last sensor in the chain, and there are modbus limits on spurs.
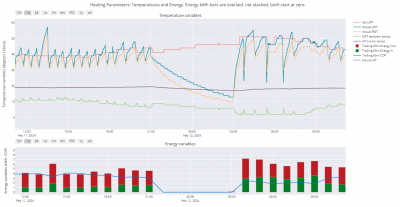
The last 24 hours have been interesting, with a marked drop in OAT last night, and, for some reason, some of the largest heat pump induced OAT variations I have see. Three of the LWT dips are defrost cycles, which may explain it, as warmer air exits from the heat pump. What we may be looking at is cooler than 'true' OAT during normal running, warmer than 'true' OAT during defrosts, with the 'true' OAT somewhere in the middle.
The other thing is I think the cooler exhaust air may be partly responsible for the defrost cycles. they normally start appearing at around 4-5 degrees, during the setback the OAT went down to 6 degrees, then when the heat pump started up again the OAT dropped to 2 degrees. What we don't know is how much, if any, of that drop came from the 'true' OAT dropping, and how much from cold exhaust air, but however it came about, it triggered defrosts and the COP plummeted, from around 4 to around 2.
Midea 14kW (for now...) ASHP heating both building and DHW
- 27 Forums
- 2,495 Topics
- 57.8 K Posts
- 259 Online
- 6,220 Members
Join Us!
Worth Watching
Latest Posts
-

RE: Solis inverters S6-EH1P: pros and cons and battery options
Just to wrap this up here for future readers: The S...
By Batpred , 26 minutes ago
-

RE: Electricity price predictions
I get the scientific argument however I would ask what ...
By JamesPa , 31 minutes ago
-
RE: Struggling to get CoP above 3 with 6 kw Ecodan ASHP
Welcome to the forums.I assume that you're getting the ...
By Sheriff Fatman , 33 minutes ago
-

RE: What determines the SOC of a battery?
I agree. Fogstar confirmed that the Seplos BMS does ...
By Batpred , 52 minutes ago
-
RE: Humidity, or lack thereof... is my heat pump making rooms drier?
I've found that generally the humidity in the house is ...
By IRMartini , 1 hour ago
-
RE: Say hello and introduce yourself
@editor @kev1964-irl This discussion might be best had ...
By GC61 , 2 hours ago
-

RE: Testing new controls/monitoring for Midea Clone ASHP
@benson — as @tasos suggests, plotting multiple variabl...
By cathodeRay , 4 hours ago
-

@painter26 — as @jamespa says, it's for filling and re-...
By cathodeRay , 6 hours ago
-

RE: Oversized 10.5kW Grant Aerona Heat Pump on Microbore Pipes and Undersized Rads
@uknick TBH if I were taking the floor up ...
By JamesPa , 17 hours ago
-

RE: Getting ready for export with a BESS
I would have not got it if it was that tight
By Batpred , 18 hours ago
-

RE: Setback savings - fact or fiction?
I also need to correct something I said by mistake earl...
By cathodeRay , 18 hours ago
-
RE: Need help maximising COP of 3.5kW Valiant Aerotherm heat pump
@judith thanks Judith. Confirmation appreciated. The ...
By DavidB , 21 hours ago
-

RE: Recommended home battery inverters + regulatory matters - help requested
That makes sense. I thought better to comment in this t...
By Batpred , 22 hours ago
-
Bosch CS5800i 7kW replacing Greenstar Junior 28i
My heat pump journey began a couple of years ago when I...
By Slartibartfast , 22 hours ago
-

RE: How to control DHW with Honeywell EvoHome on Trianco ActiveAir 5 kW ASHP
The last photo is defrost for sure (or cooling, but pre...
By JamesPa , 24 hours ago
-

RE: Plug and play solar. Thoughts?
Essentially, this just needed legislation. In Germany t...
By Batpred , 1 day ago
-
RE: A Smarter Smart Controller from Homely?
@toodles Intentional opening of any warranty “can of wo...
By Papahuhu , 1 day ago
-
RE: Safety update; RCBOs supplying inverters or storage batteries
Thanks @transparent Thankyou for your advic...
By Bash , 1 day ago
-
RE: Air source heat pump roll call – what heat pump brand and model do you have?
Forum Handle: Odd_LionManufacturer: SamsungModel: Samsu...
By Odd_Lion , 1 day ago
-
RE: Configuring third party dongle for Ecodan local control
Well, it was mentioned before in the early pos...
By F1p , 2 days ago
-

RE: DIY solar upgrade - Considering adding more panels
I know this is a bit old, but it made me wonder what co...
By Batpred , 2 days ago
-

RE: New Vaillant aroTherm Plus in black - When will it come to the UK?
@majordennisbloodnok Daikin, take note! (In fact, I hav...
By Toodles , 2 days ago
-

RE: Midea ASHP – how to set weather compensation
@mk4 — good work! First, I agree, no evidence of cycl...
By cathodeRay , 2 days ago


