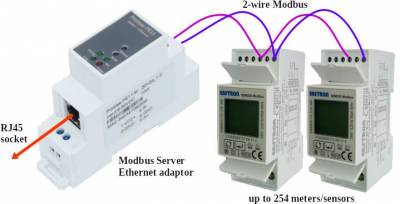
If that 3-phase meter is designed/made in Germany, then it is a very good price.
I would usually expect to pay more for German quality.
The two main manufacturers of Modbus energy meters are Acrel and Eastron.
Both are Chinese of course!
Energy Meters marked MID have been tested, and they are accurate for the purpose of a bill/invoice.
A MID meter usually arrives with a test certificate.
Definitions:
Modbus is an agreed format of commands which can be sent and received.
Each Modbus device will have a document which describes the commands for it.
RS485 is a physical connection system. It has a specification for speed and voltages.
It uses two wires, marked A and B, which can be connected to 255 devices.
The wires are twisted together to reduce interference.
There may also be an earth wire. Most devices do not use this.
Not all Modbus devices have RS485 connections.
They might use Modbus commands over ethernet, for example.
So take care when choosing Modbus items!
I am providing this information because you said that you are 'interested to change the controlling a little bit'.
You must choose which meters and sensors you want to try.
We can then suggest the correct name for what you need, and where you can buy those parts. 🙂
Save energy... recycle electrons!
Posted by: @transparentDefinitions:
Modbus is an agreed format of commands which can be sent and received.
Each Modbus device will have a document which describes the commands for it.RS485 is a physical connection system. It has a specification for speed and voltages.
It uses two wires, marked A and B, which can be connected to 127 devices.
The wires are twisted together to reduce interference.
There may also be an earth wire. Most devices do not use this.Not all Modbus devices have RS485 connections.
They might use Modbus commands over ethernet, for example.So take care when choosing Modbus items!
Thanks for adding this, good clear explanation. To add a probably superfluous analogy, given an old fashioned telegraph system, the wires and all the other paraphernalia plus voltages etc are the RS485 bit, and the the Morse code is the modbus bit. Not perfect, I know, because of things like masters and slaves and serial not parallel connections, but, at least for me, it helps separate the what of the communication from the how of the communication. Modbus is what gets communicated, RS485 (or indeed ethernet) is how it gets communicated.
Midea 14kW (for now...) ASHP heating both building and DHW
Posted by: @cathoderayapproximation to actual values.
Even your system should be working at a COP of 4.5 when it starts from cold.
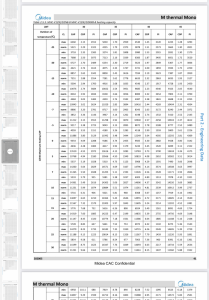
I very much doubt this. Heat pumps have to work harder when starting from cold (that's one reason why we run them 24/7). Not even Midea's own data claim COPs this high. At lower ambient temps, around zero, and at radiator LWTs (40 degrees plus), their data has COPs in the 2-3 range (source: page 44-45 of the Engineering Data manual). According to the same data, to get a COP of over 4 at a LWT of 50 degrees, the ambient temp needs to be 20 degrees or more, when I respectfully suggest only a berk would be running their heating.
This is a fundamental problem with heat pumps, and especially heat pump mar
When the heat pump starts from cold the LWT and RWT are both low, therefore it does not have to produce very high temperature output. I’ve included the engineering data for the 12kW model I have with the COPs at various outside air temperatures and target water temperatures.
Generally speaking without all the modbus recording you are are doing I read the output heat capacity (in kWs) and divide by the electrical power from the energy monitor (generally between 1 and 2.5 kW with output 4-11 kW). I deduct the secondary heat pump power as I doubt the Midea data was measured with one. Generally speaking I think their data and my estimates are in line.
The outside temperature does have a significant impact on the COP as the engineering data shows. I’m not sure what yours is. Most of the winter I have run mine at 38C except when the temperature drops near or below zero, when I increase it to 40-42C. Our house EPC is B(78). I want to improve the loft insulation before next winter.
In DWT mode the pump ramps up the LWT as the tank temperature rises, so the COP gradually drops. Obviously in heating mode it aims at a fixed temperature. Recently I dropped the target to 35C.
In another thread I saw that someone suggested that the compressor cutting out after 30-40 minutes is okay, and this is not regarded as cycling. The compressor seems to feed its output into a buffer and presumably it uses the buffer to even things up. I suppose when the buffer temperature gets too high it decides to shut the compressor down for a while to restore the target water temperature settings and DeltaT. The output capacity remains much the same despite the input power dropping.
An energy meter gives a picture of this, which is why I posted the minute by minute power graph (each bar is a minute in case it was not obvious). This gives some insight into the problem that is baffling you when you calculate COP. Instantaneous COP is only really meaningful in the steady state, although averaging during a compressor cycle or over and hour or longer is as long as thermostatic valves are not opening and closing. When the compressor starts it draws more power for a minute or so and then drops back. I’d suggest you modify your code to reflect the actual way the heat pump works. It’s a matter of accumulating energy in and out over differing periods before calculating the COP for each.
I’m just a retired systems/software engineer who did nuclear physics research at Oxford. I worked on telephone systems, medical diagnostics imaging systems, and many more innovative systems. Things are quite easy when you understand what you are trying to achieve.
Phil
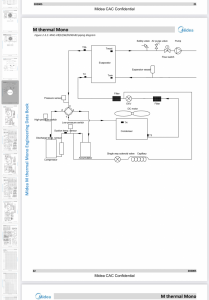
I found this schematic in the Midea engineering data document. The basics design can viewed as consists of four parts:
1. A compressor, condenser, fan, inverter with sensors and actuators;
2. A heat exchanger, tank (buffer) with optional heater connected on one side to the refrigerant loop and on the other to the water loop;
3. A water circulation system (with pump, LWT, RWT, Water Flow Rate) connecting via a diverter valve to either the DHW (with temperature sensor) or heating (controlled either by demand or room temperature sensor;
4. Control Logic - The control logic monitors the demand from the DHW and heating side and for each mode transfers heat energy at a certain temperature (LWT) to the water circulation system.
In order to monitor the efficiency of this system there is a need to measure the energy in an out. There are two different modes of operation:
1. Fixed target LWT;
2. Variable target LWT to raise a heat store (DHW cylinder) to a set temperature.
There is also a cold start mode which precedes these modes to establish a steady state (in an ideal world) and a pause mode which stops the compressor until the LWT is restored to within a stable value relative to other control parameters (RWT, flow rate, compressor control parameters etc).
So the heat pump can transfer heat energy produced by the compressor even when the compressor is not operating because that heat energy is stored. If the heat pump unit stops it will contain heat that cannot be transferred to the home DHW or heat emitters. It would be nice to monitor the amount of wasted heat.
The COP can be classed as
1. steady state measured as the ration of power in to power out, and characterised by relatively constant LWT and ambient air temperature;
2. Cumulative measured by the ratio of energy in to energy out over a period sufficiently long for energy stored within the heat pump system to be small enough to disregard. There are different measures for DHW and heating characterised by differently (DHW has initial and final temperature along with average ambient air temperature);
3. Seasonal for heating.
The presentation of COP for 1 and 2 probably involve scatter plots against time and ambient temperature.
The above is a start for developing the requirements for a ASHP monitoring system. Constructive comments welcome.
Phil
@filipe - I think the reason why you haven't received any comments so far might be because you are over-complicating things. COP, for example, is at its heart extremely simple, energy out divided by energy in, over a period of time. I very nearly found myself in a finite situation situation there, by writing finite period of time, but thankfully my internal sub-editor stepped in and nipped that one in the bud. A period of time is by definition finite, so no need to add the word.
I also note you do not appear to be using weather compensation, or if you are, it is not obvious. You do mention a variable LWT, but only for DHW heating, and that, I'm pretty sure, though I have yet to look at my data to confirm this, is merely the heat pump ramping up output as it heats the water. Weather compensation is pretty fundamental to running a heat pump efficiently, as I found out to my cost last spring, when I ran my heat pump for a while using a fixed LWT. Energy use over that period was much higher. Given its importance, one of the things I want to monitor is how the weather curve gets applied in the real world, and how that affects performance (COP). This will become even more relevant if/when I get round to my so called load adjusted weather compensation, that is adjusting the curve depending on current load, for example boost LWT after a setback, lower it if there is solar gain etc. Getting energy in and out and COP data for such periods will potentially provide an empirical answer to the perennial question of which uses more energy, on all the time, or setback and boost.
Midea 14kW (for now...) ASHP heating both building and DHW
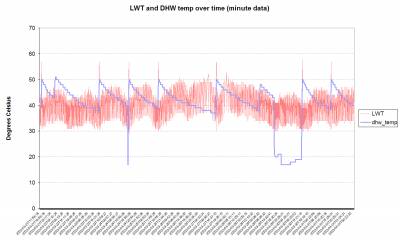
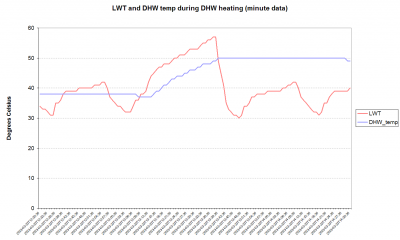
A quick and dirty spreadsheet plot of LWT and DHW tank temp, firstly over a few days, and then zoomed in (two hours) over a DHW heating period:
These are extremely fine grained minute by minute charts. In the first, you can just about see the LWT spikes corresponding to DHW heating periods, in the second you can see the detail over one such period. Apart from an initial boost, the rise in LWT looks fairly linear to me, whether that is just a characteristic of the way the heat pump works, or whether it is being active controlled by feedback from the DHW temp, I don't know. The manual may have the answer, on one of those cryptic Midea settings. The baseline saw-tooth pattern is I'm pretty sure cycling due to lid ambient temps (13-14 degrees during the two hour period in the second chart. It may be that I can reduce that cycling by lowering the LWT a fraction at the higher ambient temp end of my weather comp curve. In passing, this is why this sort of data is so useful, you can actually see what your heat pump is doing, and think about what, if anything, you can do to improve things.
Midea 14kW (for now...) ASHP heating both building and DHW
Very useful graphs @cathoderay
Reducing 'cycling' from our Heat Pumps is also an important issue for DNOs
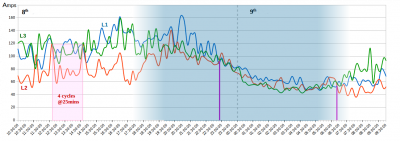
If I were to view the current being drawn from one substation feed, it can look like this:
The cycling which is evident from Heat Pumps connected to all three phases is adding to the energy losses at that substation.
I've highlighted the 25min interval for a Heat Pump on L2 because that also exhibits Phase-imbalance.
In this case, the substation is supplying a community energy project, where they're still learning about how to configure Heat Pumps.
I won't reveal where it is (to protect the guilty!), but it demonstrates why we really must work to attain a steady-state balance between our LWT and RWT.
Save energy... recycle electrons!
Posted by: @cathoderayWeather compensation is pretty fundamental to running a heat pump efficiently, as I found out to my cost last spring, when I ran my heat pump for a while using a fixed LWT. Energy use over that period was much higher.
I am really not sure about the 24/7 thing and automatic weather compensation. I only started bothering about efficiency when I joined this forum. It has been useful and my observations are that my ASHP in my home gives a COP of 3 when its load (output relative to maximum - 12kW in my case) has dropped to 30%. It increases to the benchmark figures around 60-70% load. I adjust the output temperature manually according to outside temperature. During the day we have reasonable solar gain. Once the house temperature is comfortable I turn the heating thermostat down so the pump goes off. The house can stay warm most of the day through solar gain (we have triple glazing).
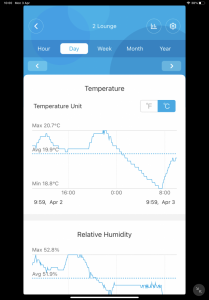
As you can see from the temperature of our lounge it holds a steady temperature in the day. The physics of heat is such that the hotter an object is the more heat it radiates. The argument for 24/7 is that a heat pump can take a long time to warm a house up. In the cold weather we can use 30 kWh/day but now it is down to 8kWh. If I had the heating on 24/7 it would use 1kWh per hour. Since October we have used for 2126kWh heating according to Midea. The gas for recent mild winters before the ASHP was installed last year was 12kWh. Our heat loss calculations indicated 12kW at -1.6 outside using MCS room temperatures. The air leakage was 50% as 1990 buildings not covered for air leakage by BRs. However, we have rendered walls rather than leaky dry lining.
Hence my suggestions for the heat pump monitoring data I would find useful. I just want total output against input for various time periods and during the a 24 hour window to see when the efficiency is dropping off relative to load.
I’d like to your daily Energy In/Out and COP data covering a week to understand your house better. Do you have concerns about the way your system works?
Do I gather you have underfloor heating? Is that what you mean by space heating? With rooms constantly going on and off the pump may never have a steady state to operate in.
Phil
First post here from me.
I chanced upon this thread yesterday and thought I'd chime in with my findings/learnings/progress.
tl;dr: I have my Midea heat pump reporting to Home Assistant in a couple of ways, one of which is modbus.
As for how? Well, I went down the Modbus direct to Home Assistant route (i.e. defining modbus sensors based on the data at various address), but found many, many problems with the approach, which I believe are more to do with the USB to RS485 dongle I'm using, and the fact I have a second Modbus slave in the mix (Freedom Heatpumps Cloud box). The fault tolerance in the HA modbus integration isn't the best, and the integration would quickly stop working after a few minutes.
Node-RED, on the other hand, was much more resilient and has excellent Home Assistant integration. As such, my integration now uses the Node-RED Addon for Home Assistant (via HACS).
I also have a second integration which uses modbus indirectly via REST(ish) through the Freedom Heatpumps Cloud (FHP) box, which is in turn connected to the Midea controller with modbus (hence indirect). This approach isn't great, as the data available is limited. I was able to derive the power out using the REST approach (specific heat capacity of water is constant, and you can get the outlet, inlet and flow rate, which is enough to derive how much power is emitted between the outlet and inlet). As for power in, I am using a Shelly EM on the heat pump and ancillaries. I've dumped the relevant bits of my config here for this in case you also have an FHP cloud box. I should add this is not polling the cloud, but polling the ESPxxx HTTP endpoints exposed by the ESPxxx device in the FHP Cloud box, so it is all local and doesn't depend on the internet.
I saw some chat in this thread about working out CoP (and I admit I haven't read all the posts nor in detail), but the key thing with CoP is *scoping* the measurements. kW in and kW out aren't enough, you need a Riemann Sum or a meter to get the energy in kWh (not instantaneous power in kW), you can then use statistics sensors to calculate the CoP over the past x minutes/hours/days/whatever. See my statistics sensors here. My values for this are under-reading, partly because the data from FHP cloud isn't the best (i.e. precision on the flow/return temps, and the flow rate has been through some unit conversions), plus also the electrical energy monitor is also reading more than just the heat pump, but its ancillaries too (controller, tado° gateway, external pumps)
I am dropping the modbus via REST approach in favour of the Modbus via node-RED approach, since the data you can get from that is much better, this is only partially complete at the moment (only reading registers, no writing). I'll share my node-RED configuration for this once I'm satisfied it's doing what it should.
Long term, I'd like to create a fully fledged integration using modbus, but that's a way off, this is more proof of concept at this stage.
@cashback - very interesting. If you haven't come across them, two other threads have info on all this:
Home Alone with Home Assistant (previously A Beginner's Guide to ASHP Monitoring)
A Beginner's Guide to Heat Pump Monitoring Reloaded (v2)
The transition from the first to the second marks the point at which I gave Home Assassin Assistant the electric elbow. The quality of contributions from other members of the forum has been outstanding. We are never afraid to speak our mind, but never aggressively so.
I'm only two weeks in to a wired modbus plus simple python scripts (I mean simple, back of the envelope stuff) plus Highcharts JS for charting. Even with this simple set up, it looks as though I can set as well as get data eg set the upper and lower end of the weather comp curve, something I might later use to achieve 'load adjusted weather compensation' - basically an adaptive curve, boost a bit when too cool (eg after overnight set back), throttle back a bit when too warm (eg solar gain). Very basic control logic: if set room temp minus actual room temp > 2 then new LWT = old LWT + 1 etc sort of thing. So far this combination has been very robust and reliable. It dealt with a recent four hour power cut without batting an eyelid.
My current calculated energy in/out figures are also suspect (COPs too high) and there has already been some discussion on the need to use some sort of area under the curve voodoo to get better estimates, including mention of a Riemann Sum approach. At the same time, I remain committed to keeping all this at a level that someone with O level (as it was in my day) maths can understand.
I look forward to fruitful collaboration!
Midea 14kW (for now...) ASHP heating both building and DHW
Posted by: @cathoderayThe transition from the first to the second marks the point at which I gave Home Assassin Assistant the electric elbow.
I don't fully understand the disdain towards Home Assistant, I've been using it for some time - my professional opinion (20+ yrs in software engineering) is that it's a really very good bit of software. Granted, I have spent little to no time in the actual codebase, but the fact it's capable of so much and on such low powered hardware is a massive win. I'm a bit tinfoil hat when it comes to The Cloud™ so it ticks lots of boxes for me. That said, some of the community integrations are, erm, iffy (there's a reason the community integrations aren't built-in integrations).
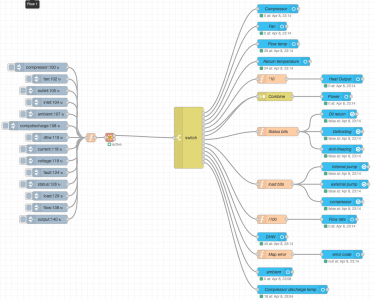
I would recommend having a go with Node-RED for the Modbus part, the wiring up is really very simple, and then you can collect the data and send it wherever you like. Here's what my configuration looks like:
A bunch of topics and their corresponding addresses on the left, piped through a modbus getter, to a switch that then sends the respective values off to their respective Home Assistant sensors - some need some additional pre-processing (for example, as you have no doubt found, heat output is in kW but needs multiplying by 10 to get the value in W, or dividing by 100 to get a float in kW). The Home Assistant sensors on the right could be anything - an MQTT topic, a web request, a spreadsheet, you name it.
I have a few gremlins I need to get to the bottom of (e.g. my hot water tank was reading 3333°C for a time today while it was 105°C outside), and a few more values to wire up, but once I figure out what's going on, I'll share my config.
Posted by: @cathoderayit looks as though I can set as well as get data eg set the upper and lower end of the weather comp curve, something I might later use to achieve 'load adjusted weather compensation' - basically an adaptive curve, boost a bit when too cool (eg after overnight set back), throttle back a bit when too warm (eg solar gain)
Ah interesting, I've been looking at something similar (I've been calling it preemptive weather compensation).
I haven't yet done any writing with modbus (my foray in to modbus began when my USB to RS485 stick arrived yesterday), but I have it working just fine after a bit of reverse engineering of the HTTP traffic from the FHP Cloud box - I'm able to toggle heating/hot water (which is how I have tado° act as the call for heat, bypassing tado°'s built-in modulation, and schedule hot water, obeying home/away detection and so on)
- 26 Forums
- 2,364 Topics
- 53.6 K Posts
- 142 Online
- 6,029 Members
Join Us!
Worth Watching
Latest Posts
-
RE: Octopus Cosy Heat Pump Owners & Discussion Thread
Yes. In addition or instead. The point us that trv b...
By JamesPa , 12 hours ago
-
-
RE: ASHP sizing - value of Heat Transfer Coefficient
@toodles Hi, my friend recently made a video about heat...
By HeatPumpMe , 17 hours ago
-

How long will your energy contract last?
Some heat pump tariffs don’t run as long as a heat pu...
By Toodles , 2 days ago
-

@morgan They are unsupervised these days, can’t get the...
By Toodles , 2 days ago
-
-

RE: Setback savings - fact or fiction?
Exactly. We only need to compare conditions, to decide ...
By cathodeRay , 3 days ago
-
RE: Balancing financial efficiency and comfort using the Octopus Cosy tariff
I found because I have very low heat loss I can set bac...
By RadWhisperer , 3 days ago
-
RE: Need Help Optimising My Rushed ECO4 Install: 12kW Bosch Heat Pump
Welcome @mickamills We too have an oversized 12kW Sa...
By Old_Scientist , 3 days ago
-
RE: My Powerwall 3 Consumes 3-4 kWh/Day in Self-Consumption: Is This Normal?
@caron I can confirm that the power usage of the PW3 is...
By Old_Scientist , 3 days ago
-
RE: Speedcomfort radiator fans
Thats true, but having tried (and succeeded) in constru...
By JamesPa , 3 days ago
-
RE: Solis S6-EH1P8K-L-PLUS – Why I Chose It and What I’ve Learned So Far
@bash brilliant, thanks for the feedback
By energy9165 , 3 days ago
-

RE: Heat Pump Heats the House… But It’s Not Cosy. Emitter Changes or System Tweak?
@alastair There I was, feeling grumpy, he said “Cheer u...
By Toodles , 3 days ago
-
RE: Grant Aerona: Is there a setting to keep the 2-port valve open during pump blockade
Depends on OAT. Mine cycles at OAT>10 and of course...
By JamesPa , 4 days ago
-
RE: New Fogstar 15.5kWh upright solution
@transparent My conclusion is as you have noted, tha...
By Bash , 4 days ago
-
RE: Mitsubishi Ecodan R290 10kW performance
And to you too. Wishing you a very enjoyable festive s...
By Sheriff Fatman , 4 days ago
-

RE: External pipework insulation
They do? But that isn't apparent from the photos we'r...
By Transparent , 4 days ago
-

RE: Say hello and introduce yourself
@velcro welcome to the forums. Please feel free start a...
By Mars , 4 days ago
-
Daikin EDLA11D3V3 DHW Settings
I have a newly installed EDLA11D3V3 which I'm still get...
By Velcro , 4 days ago
-
RE: Midea ASHP – how to set weather compensation
@curlykatie did you get sorted with this?
By MickaMills , 5 days ago

