Creative trials on Night-time Setbacks to @ faster recovery, improved comfort and even greater energy reductions.
I would certainly agree that the heat pump operation is causing an increase in defrost cycles and also a reduction in efficiency.
Definition of setback.
we have tried different set back temperatures to see what fits our Low mass building. In other words our house warms up quickly but it also cools down relatively quickly. We also have radiators rather than a high mass slow release slab of under floor heating so efficiency is somewhat curtailed by the properties of our house. So we are having to try and make the most of what we have.
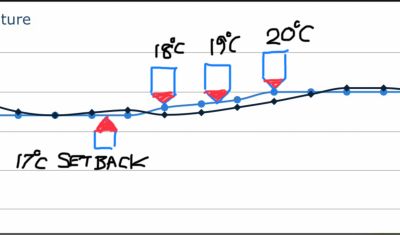
We are operating a setback from daytime 21c back to 17c between the hours of 9pm and 4am. The ramp up in the morning starts at 4am and is achieved in 1c increments with 1.5 hours between each 1c rise taking our set temperature up to 20c. The incremental rises are designed to keep the Auto Adaptive controller operating at a minimal output so that the feedback loop doesn’t see large temperature rise targets. The 21c room temp is achieved by Auto Adaptive always over running the target by half or one degC.
There have been several observations about how the system works along the way to finding the best setting for the widest outside temperature ranges. If ever there was a system which didn’t want to be controlled it would be the Heat Pump.
Nonetheless we have persevered and found several ‘unknown unknowns’ and turned many into ‘known unknowns’.
Perhaps the most surprising of these has been to understand ‘Freeze Stat Function.’
Just when you think you have everything under control Freeze Stat Function decides to switch on at 2am and operate right through to the morning ramp up.
CAUTION (with our Ecodan)
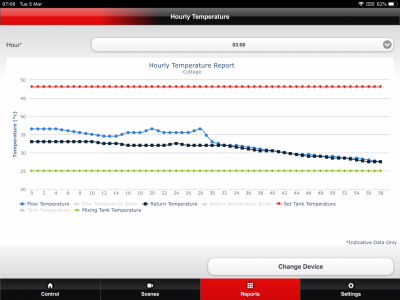
Freeze Stat Function takes Operational Priority over scheduled temperature changes. In other words the HP continues operating at minimal output instead of responding to Auto Adaptive Set Temperature asking for temperature rise!? As yet I haven found a way of prioritising AA set temp over Freeze Stat.
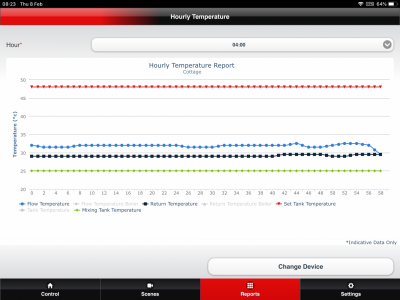
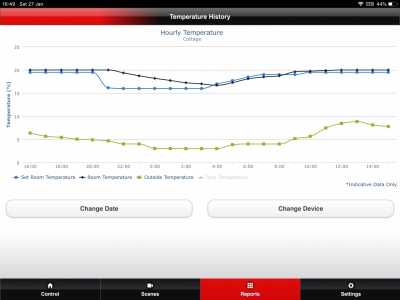
Stuck in Freeze Stat instead of starting the morning ramp up at 4am
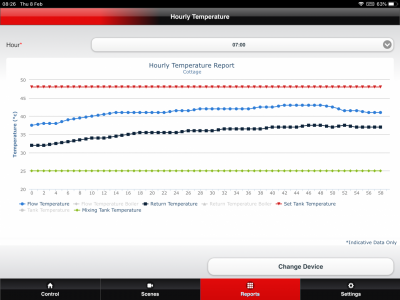
Meanwhile 3 hours later the HP starts the ramp up playing catch-up with the AA target room temperature
Nothing's ever simple.
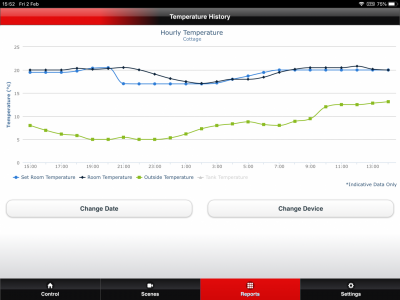
Here you might be able to see Freeze Stat stopping room temperature from rising until later in the morning.
In summary the purpose of these trials have been to see if there are any energy savings in having an automated setback over a 7 hour period of night time, while still guaranteeing a comfortable room temperature of 20.5c between the hours of 8.00am or earlier and 10.30pm.
Here is a 24 hour chart of operation of a typical day with a setback which closely follows the set temperature using Auto Adaptive room temperature control.
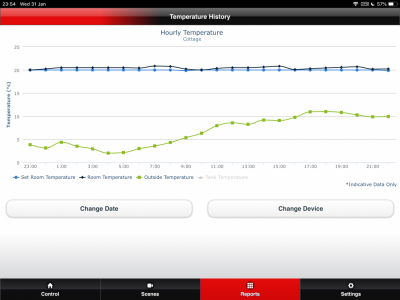
Here is a comparison of a recent continuous operation chart showing the same even target room temperature of 20c with the same over run of More or less 1c. So it’s quite difficult to get an exact 21c constant room temperature.
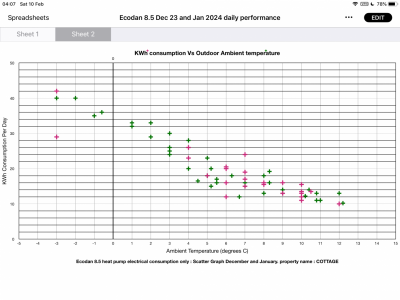
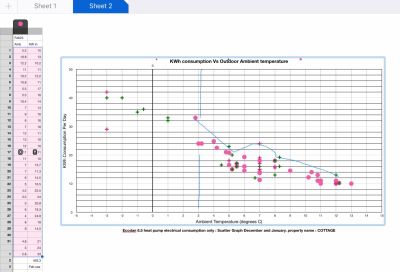
The attached scatter graph shows all the daily energy our heat pump has consumed for December (pink crosses) January and February (green crosses)
Can anybody identify the 4 days when the heat pump operated for 24 hours continuously?
The debate is : Is there any energy saved by operating the heat pump with a setback compared to operating continuously? With the proviso that a minimum room temperature of 20.5c must be attained between the hours of 8.00am and 10.30pm.
who can improve on @cathoderay s guess he has identified one of the 24 hour days.
there are clues in the previous page of this thread.
and @cathoderay identified the pink cross correctly.....
The results of our trials: There were 4 continuous 24 hour trials which coincided with 4 different outside ambient temperatures. These temperatures were:
- 12c Ambient
- 8c Ambient
- 7c Ambient
- 5c Ambient
These tests coincided with clusters of set back trials done at the same Ambient temperatures and the 24 hour energy consumption of all trials were recorded.
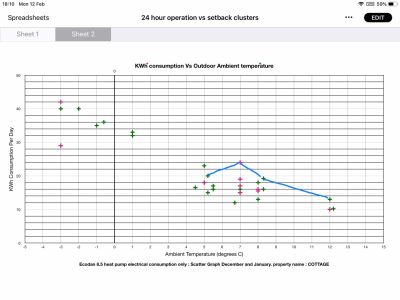
The attached scatter graph shows the 4 continuous operation energy consumption outputs linked by the blue pencil line while the clusters of the equivalent setbacks done on the same Ambient temperature days are shown in their location.
It can be seen that in all cases, except one, energy consumption was higher in the continuous operation day than all of the 18 setback trials. It can also be seen that the trials were well clustered. The actual difference between the 24 hour trial and the mean average of the equivalent ambient temperature was as follows:
- 12c Ambient, for continuous operation =2.9kwh above mean consumption
- 8c Ambient, for continuous operation = 3.5kwh above mean consumption
- 7c Ambient for continuous operation = 8.2kwh above mean consumption
- 5c Ambient for continuous operation = 2.42kwh above mean consumption
(mean consumption refers to the aggregated consumption of the setback trials clustered at same Ambient temperature divided by the number of trials.)
exceptions: there appears to be a considerable difference at the 7c Ambient which may be attributable to the notion that my December ambient observations were not so rigorously well refined as January and February data.
NB I have removed neighbouring trials outside the ambient ranges as they may only serve to distract.
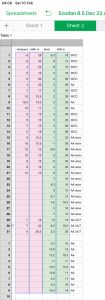
however I attached all the data of the scatter graph in the spreadsheet below. It’s important to remember that these are not just dots on a graph.... each cross represents an entire 24 hour period with recorded events through each day.
Obviously I would like to have done some colder day comparisons to see what the differential might be during defrosts and freeze stat function over the night time without the setback but perhaps February might yet deliver such a day.
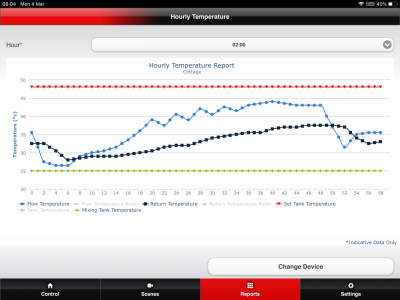
The colder it gets the More energy is saved! We have at last managed to trial a 24 hour continuous operation of our heat pump at sub3degC. This means it was operating in the defrost zone. We were typically getting one defrost per hour with a recovery to 40 or 45c and a DT OF 8 to maintain a room temp of 19.5c overnight and through the day.
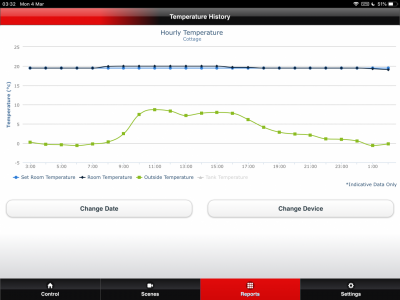
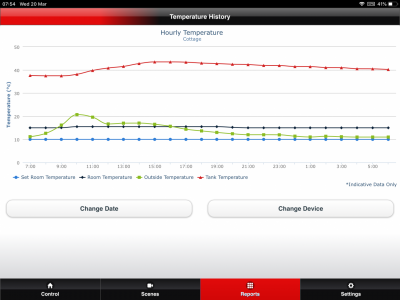
here is the 24 hour room temp chart showing outside ambient.
The hourly output typical of every hour when the outside temperature was below 3C resulted in this same ramp up just to maintain the room temperature in Auto Adaptive mode.
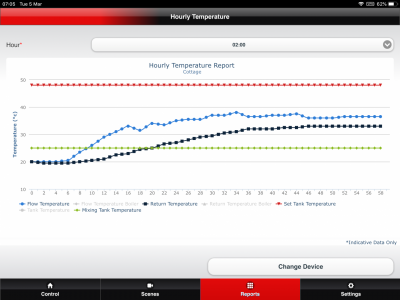
This is in stark contrast to how the HP operates during a setback when the freeze stat function takes over and automatically manages the circulation flow temperature of the wet system.
So because Freeze Stat is only trying to heat the flow water to about 30c it can warm it at a slower more efficient rate then just switch off.
the net result on the test we did on 3rd March was a shocking 9kwh more energy consumption compared to 2 other dates where set back was used. All 3 were in sub 3c averaged OAT.
HERE IS A SCATTER GRAPH of the last month added to the previous test days.
Setback =24kwh at 3c
24/7 = 33kwh at 3c
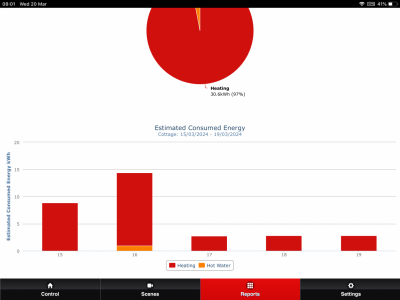
Estimated energy consumption from Ecodan. There is a standard energy add-on to our estimated consumption with our Ecodan when the system is put on a continuous setback.
This is 2.8KWh regardless of energy consumption.
This consumption graph shows 2 days normal consumption and 3 days setback (apparent) consumption when the room stat was set back to 10C. In this period there have been no defrosts and no Freeze stat operation and no pump circulation.
My assumption is that this is a programmed correction factor applied to the standard calculated figure possibly to account for unknown secondary and zone pumps which may not be wired via the main controllers power system. This, in theory would give an approximation for additional energy. Plus there will be an additional energy for the monitoring system itself which might amount to possibly 200Wh in a 24 hour period.
our system only uses one pump and consumes 47w when it’s on. But during this long srtback the pump hasn’t switched on.
An important message this knowledge gives Ecodan owners is the system doesn’t appear to under estimate energy consumption. But it also confirms to me that there appears to be no variable ratio added on to a daily consumption total. There only appears to be a fixed daily correction figure added to the daily energy estimate regardless of how much energy is actually consumed by the Heat Pump.
So during a long setback period the calculated CoP would become distorted if 2.8 kw is added to the accumulated consumption figure.
What I don’t know (and Mitsubishi are not telling me) is; Is the 2.8kwh added to a fully operating 24 hour period, is it added to a partial night time setback period or is it only added to a 24hour setback period?
Anyway.
To other things. While Our system is “off” it’s nice to see the solar thermal panel is now getting enough sun energy, even in overcast weather to raise the cylinder temperature to 42c. It’s not enough yet to rely on but in 1 month time this will be our only DHW supply.
Its also interesting to see the room temperatures staying around 15c with no heating. But I guess that’s because it’s so mild outside.
I think that the Ecodan controller can record the energy consumed by up to four water pumps. Obviously it can only record the actual energy consumed by each water pump if they have an associated power meter. To accommodate systems without additional power meters it is possible to set a fixed, estimated, power consumption value for each of the four water pumps. I believe that these estimated values, if set, are totaled whether the water pump is installed and operating or not.
Have a look at the electrical power measurement section of the instruction manual.
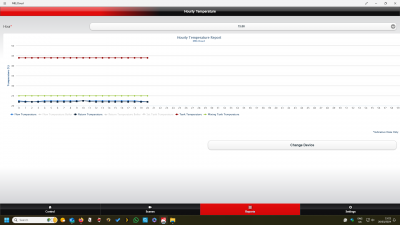
@sunandair How do you choose the options to display in your hourly temp' graph? As you can see from mine, I don't have the same options. Is it necessary for the installer to change or is it possible for a user to adjust?
Retrofitted 11.2kw Mitsubishi Ecodan to new radiators commissioned November 2021.
14 x 500w Monocrystalline solar panels.
2 ESS Smile G3 10.1 batteries.
ESS Smile G3 5kw inverter.
Thanks for that information Derek. Really useful. I will look into the estimated power setting and see if there is a way of getting it adjusted. I’ll let you know how I get on.
Hi @Morgan
the report I posted was a 24 hour ‘temperature history’ report
it has all the pre set temperatures you see on the Graph.
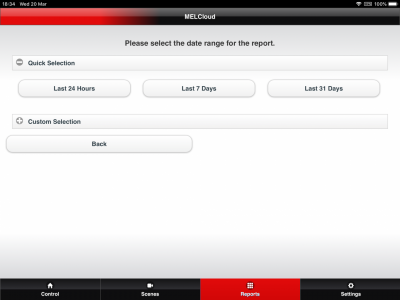
i just select temperature history then it gives me options for time periods.... see attached:
I then select ‘last 24 hours’ then just tick the temperatures you want to display or de select the ones you don’t want to display. Hope hat helps...
adddd....
it has pre loaded in the report: room temp, target room temp, outside ambient temp, tank temp and target tank temp. I think the last 24 hour selection is a good time span but you can also go back in time and get a specific 24 hour time period for a given date.
@sunandair I get all of your first part but…………..I don’t those options ‘pre loaded’ in the report. I get the options you see in my image. If you, or anybody, knows how I change/edit the options I’d be keen to learn.
Retrofitted 11.2kw Mitsubishi Ecodan to new radiators commissioned November 2021.
14 x 500w Monocrystalline solar panels.
2 ESS Smile G3 10.1 batteries.
ESS Smile G3 5kw inverter.
@sunandair I see that now. I just read 'Hourly Temp' and jumped to the wrong conclusion. Thanks for that.
Retrofitted 11.2kw Mitsubishi Ecodan to new radiators commissioned November 2021.
14 x 500w Monocrystalline solar panels.
2 ESS Smile G3 10.1 batteries.
ESS Smile G3 5kw inverter.
- 27 Forums
- 2,495 Topics
- 57.8 K Posts
- 259 Online
- 6,220 Members
Join Us!
Worth Watching
Latest Posts
-
RE: Setback savings - fact or fiction?
@cathoderay The input power is largely determined by...
By RobS , 12 minutes ago
-

RE: Humidity, or lack thereof... is my heat pump making rooms drier?
@editor, this is now an example of greenwashing in the ...
By Majordennisbloodnok , 23 minutes ago
-

RE: Electricity price predictions
@transparent Im impressed by all your work on this. ...
By JamesPa , 2 hours ago
-

RE: Solis inverters S6-EH1P: pros and cons and battery options
Just to wrap this up here for future readers: The S...
By Batpred , 2 hours ago
-
RE: Struggling to get CoP above 3 with 6 kw Ecodan ASHP
Welcome to the forums.I assume that you're getting the ...
By Sheriff Fatman , 2 hours ago
-

RE: What determines the SOC of a battery?
I agree. Fogstar confirmed that the Seplos BMS does ...
By Batpred , 3 hours ago
-
RE: Say hello and introduce yourself
@editor @kev1964-irl This discussion might be best had ...
By GC61 , 4 hours ago
-

RE: Testing new controls/monitoring for Midea Clone ASHP
@benson — as @tasos suggests, plotting multiple variabl...
By cathodeRay , 6 hours ago
-

@painter26 — as @jamespa says, it's for filling and re-...
By cathodeRay , 8 hours ago
-

RE: Oversized 10.5kW Grant Aerona Heat Pump on Microbore Pipes and Undersized Rads
@uknick TBH if I were taking the floor up ...
By JamesPa , 18 hours ago
-

RE: Getting ready for export with a BESS
I would have not got it if it was that tight
By Batpred , 20 hours ago
-
RE: Need help maximising COP of 3.5kW Valiant Aerotherm heat pump
@judith thanks Judith. Confirmation appreciated. The ...
By DavidB , 23 hours ago
-

RE: Recommended home battery inverters + regulatory matters - help requested
That makes sense. I thought better to comment in this t...
By Batpred , 24 hours ago
-
Bosch CS5800i 7kW replacing Greenstar Junior 28i
My heat pump journey began a couple of years ago when I...
By Slartibartfast , 24 hours ago
-

RE: How to control DHW with Honeywell EvoHome on Trianco ActiveAir 5 kW ASHP
The last photo is defrost for sure (or cooling, but pre...
By JamesPa , 1 day ago
-

RE: Plug and play solar. Thoughts?
Essentially, this just needed legislation. In Germany t...
By Batpred , 1 day ago
-
RE: A Smarter Smart Controller from Homely?
@toodles Intentional opening of any warranty “can of wo...
By Papahuhu , 1 day ago
-
RE: Safety update; RCBOs supplying inverters or storage batteries
Thanks @transparent Thankyou for your advic...
By Bash , 1 day ago
-
RE: Air source heat pump roll call – what heat pump brand and model do you have?
Forum Handle: Odd_LionManufacturer: SamsungModel: Samsu...
By Odd_Lion , 1 day ago
-
RE: Configuring third party dongle for Ecodan local control
Well, it was mentioned before in the early pos...
By F1p , 2 days ago
-

RE: DIY solar upgrade - Considering adding more panels
I know this is a bit old, but it made me wonder what co...
By Batpred , 2 days ago
-

RE: New Vaillant aroTherm Plus in black - When will it come to the UK?
@majordennisbloodnok Daikin, take note! (In fact, I hav...
By Toodles , 2 days ago
-

RE: Midea ASHP – how to set weather compensation
@mk4 — good work! First, I agree, no evidence of cycl...
By cathodeRay , 2 days ago

