Xlinks and other strategies to achieve nett zero
Thanks for that link @jeff
I need to write to Ofgem about their current appraisal. It's got tied up in an attempt to resolve the historical CfD (Contracts for Difference) pricing which plagues the electricity wholesale market. I can see why respondents to Ofgem's consultations are concerned to see a financial resolution to this... because it's an important way by which profits are made in the UK energy market. That suggests to me that the majority of consultees were active participants in that market. 😣
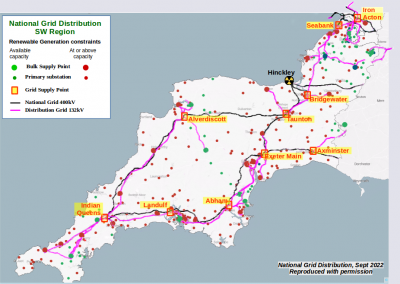
The present proposal is based on the idea that the nodes would be based around the GSP transformers... the ones that interface between the distribution grid (132kV & below) and the national transmission grid. For clarity, here's an updated version of my earlier map, onto which I've inserted a layer showing the ten GSPs in my own SW Region:
This graphic is a composite based on the Constraints Map published by NG-Distribution. Some details have been removed or obscured for national security reasons.
SW England region is a good choice for demonstrating this point. It's already approaching an average balance of supply & demand over the year, so it's a fair representation of where the country must head in order to achieve Net Zero by 2050.
It's already obvious that the majority of the Primary and BSP transformers are operating at or above capacity to accept further renewable generation. To alleviate this, the financial incentive to consume/store electricity needs to operate below the GSP transformer level.
Save energy... recycle electrons!
@transparent 32.7% of electricity is used domestically nationally.
Just curious.
What are your thoughts on non domestic users in the South West?
Is there any data on who is using the electricity on each of the transformers you mention in the SW? Even if it is estimated?
I hadn't realised it was 32.7% domestic usage. That's a useful statistic... although I suspect that the non-domestic use has a significant proportion of customers who are mega-users such as steel-works, and glass/pottery factories.
There is no such information available from the NG-Dist data I have. Individual customers can't be identified as such. I would have to first decide on a locality of interest, and then drill down to look at the current flows. But I'm not sure it's worth my time to investigate how much electricity passes through the Primary Substation next to Port Talbot steel works! We can already guess that answer.
BTW I have access to all four NG-Dist regions' data, not just SW. So if I wanted spend days writing scripts to pull data into spreadsheets, I'm sure I could discover all sorts of useful comparisons across the country. I'm obviously interested in findings that could take the country forward in the way we move to widespread renewable generation. So it's likely I'm viewing this treasure-trove of data differently to the way in which the energy-industry envisage using it.
In a nutshell I think the country needs to be attracting business users to locate themselves in areas where there is more abundant green electricity generation.
The over-supply of electricity in locations at the extremities of the original National Grid should be an incentive for commercial/technological regeneration, rather than seen as a problem which requires massive/costly infrastructure upgrades.
Take a step back, and ignore all the complex formulae currently in use to pay NG-Transmission and the DNOs for UoS (Use of Service):
If we 'grew' GB's renewable electricity network based on the locations and time-frames when it could be generated, what would the resulting grid look like?
- Would it be like a honeycomb of hexagons which interlink the locations of supply and demand?
- Or would it look like a copse of trees in which multiple roots gather electricity and send it through just a few hundred tree-trunks to be distributed by the branches?
Whatever that 'biological' pattern looks like, then that's likely to be the most effective and resilient way in which our grid should evolve.
Save energy... recycle electrons!
Table 5.2
Worth bearing in mind they have included 8% for losses generally in one of the non domestic buckets as an example. So care needs to be taken depending on how the figures are used i think.
Anyway might be some stuff you find useful.
Interesting Iron and Steel is 1% probably as we have lost a lot of that industry and a lot is yet to convert to electricity.
I agree encouraging business and people to areas with excess electricity sounds like a great thing.
Thanks for that link @jeff
Yes, they've assigned 8% for losses in the part of the graphic which is non-domestic because it occurs before the meter.
But the losses which are of most concern are those of phase-imbalance. By definition that is due to usage or export from premises that are single-phase... which includes 99% of our housing.
Let's imagine a local substation supplying an estate with 150 houses, a primary school, a shop and a community hall. The first home to install PV panels with a grid-tied inverter will cause grid imbalance. Three homes with PV might restore balance, but only if they are split between the three phases and on the same transformer feed. In practice no account is taken of this. Few domestic properties even have any record of which phase supplies them.
Imbalance will again occur with the first house to install an EV charger or a heat-pump. That's why both of these require LCT (Low Carbon Technology) approval from the DNO.
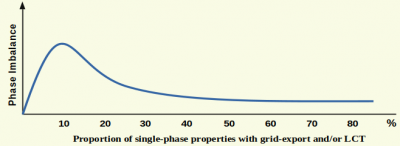
In broad terms phase imbalance increases until that technology is installed in about 10% of properties:
Phase imbalance can't be entirely eradicated because there are personal choices being made by householders wrt their decision to buy into each type of technology and when to run it.
But it's obvious that we must get adoption of such technology beyond the 10% region of the graph. Unfortunately, that's roughly the current uptake of grid-tied PV panels. 😣
Save energy... recycle electrons!
Unfortunately @jeff, long before Xlinks is active, it will be Hinkley C which will have dramatically reduced the carbon footprint of SW and S Wales regions.
Save energy... recycle electrons!
Posted by: @transparentUnfortunately @jeff, long before Xlinks is active, it will be Hinkley C which will have dramatically reduced the carbon footprint of SW and S Wales regions.
And further plants of some sort are likely (?) in the country given current Labour and Conservatives and Liberal Democrat policy is pro Nuclear for energy security.
The main political parties are pro-nuclear because they're not being presented with alternative viable options which combine renewables and storage.
Every time we're about to crack that problem, demand rises instead (EVs and Heat Pumps).
If only we could find someone who's in the same constituency as the MP running BEIS 😉
Save energy... recycle electrons!
Posted by: @transparentThe main political parties are pro-nuclear because they're not being presented with alternative viable options which combine renewables and storage.
Every time we're about to crack that problem, demand rises instead (EVs and Heat Pumps).
If only we could find someone who's in the same constituency as the MP running BEIS 😉
I am sure the government is inundated with groups telling them about a "viable" option...
Wading through the noise to get a pragmatic, realistic, deliverable and politically acceptable short, medium and longer term vision and plan can't be easy. There is an awful lot of content out there already.
I am very positive about us getting off fossil fuels, am sure we will find a pragmatic way through it. It won't be a perfect ground up solution and it will take time.
Am particularly impressed with the speed of off shore wind turbine deployment planned and in progress. Lot's of other positive things going on.
If we ever send Grant anything or speak to him, it needs to something he can realistically follow through on. That would be my first test personally.
- 27 Forums
- 2,495 Topics
- 57.8 K Posts
- 303 Online
- 6,220 Members
Join Us!
Worth Watching
Latest Posts
-

RE: Electricity price predictions
I am always impressed with how you keep abreast of so m...
By Batpred , 1 minute ago
-

RE: Setback savings - fact or fiction?
I fully understand your reasoning, same steady inputs s...
By cathodeRay , 10 minutes ago
-
RE: Humidity, or lack thereof... is my heat pump making rooms drier?
@majordennisbloodnok I’m glad I posted this. There see...
By AndrewJ , 32 minutes ago
-
RE: What determines the SOC of a battery?
@batpred I didn't write the Seplos BMS software, I a...
By Bash , 2 hours ago
-
RE: Testing new controls/monitoring for Midea Clone ASHP
@tasos and @cathoderay thanks. I have some history grap...
By benson , 2 hours ago
-

I am having my existing heat pump changed to a Vaillant...
By trebor12345 , 3 hours ago
-
Our Experience installing a heat pump into a Grade 2 Listed stone house
First want to thank everybody who has contributed to th...
By Travellingwave , 3 hours ago
-

RE: Solis inverters S6-EH1P: pros and cons and battery options
Just to wrap this up here for future readers: The S...
By Batpred , 6 hours ago
-
RE: Struggling to get CoP above 3 with 6 kw Ecodan ASHP
Welcome to the forums.I assume that you're getting the ...
By Sheriff Fatman , 6 hours ago
-
RE: Say hello and introduce yourself
@editor @kev1964-irl This discussion might be best had ...
By GC61 , 8 hours ago
-

@painter26 — as @jamespa says, it's for filling and re-...
By cathodeRay , 11 hours ago
-

RE: Oversized 10.5kW Grant Aerona Heat Pump on Microbore Pipes and Undersized Rads
@uknick TBH if I were taking the floor up ...
By JamesPa , 22 hours ago
-

RE: Getting ready for export with a BESS
I would have not got it if it was that tight
By Batpred , 24 hours ago
-
RE: Need help maximising COP of 3.5kW Valiant Aerotherm heat pump
@judith thanks Judith. Confirmation appreciated. The ...
By DavidB , 1 day ago
-

RE: Recommended home battery inverters + regulatory matters - help requested
That makes sense. I thought better to comment in this t...
By Batpred , 1 day ago
-
Bosch CS5800i 7kW replacing Greenstar Junior 28i
My heat pump journey began a couple of years ago when I...
By Slartibartfast , 1 day ago
-

RE: How to control DHW with Honeywell EvoHome on Trianco ActiveAir 5 kW ASHP
The last photo is defrost for sure (or cooling, but pre...
By JamesPa , 1 day ago
-

RE: Plug and play solar. Thoughts?
Essentially, this just needed legislation. In Germany t...
By Batpred , 1 day ago
-
RE: A Smarter Smart Controller from Homely?
@toodles Intentional opening of any warranty “can of wo...
By Papahuhu , 1 day ago
-
RE: Safety update; RCBOs supplying inverters or storage batteries
Thanks @transparent Thankyou for your advic...
By Bash , 1 day ago
-
RE: Air source heat pump roll call – what heat pump brand and model do you have?
Forum Handle: Odd_LionManufacturer: SamsungModel: Samsu...
By Odd_Lion , 1 day ago
-
RE: Configuring third party dongle for Ecodan local control
Well, it was mentioned before in the early pos...
By F1p , 2 days ago
-

RE: DIY solar upgrade - Considering adding more panels
I know this is a bit old, but it made me wonder what co...
By Batpred , 2 days ago


